Pre-check the SDDC warning “Checks whether the SDDC Manager VM system directory has enough disk space”.

By Lerpong Intaraworrapath | 29th July 2022

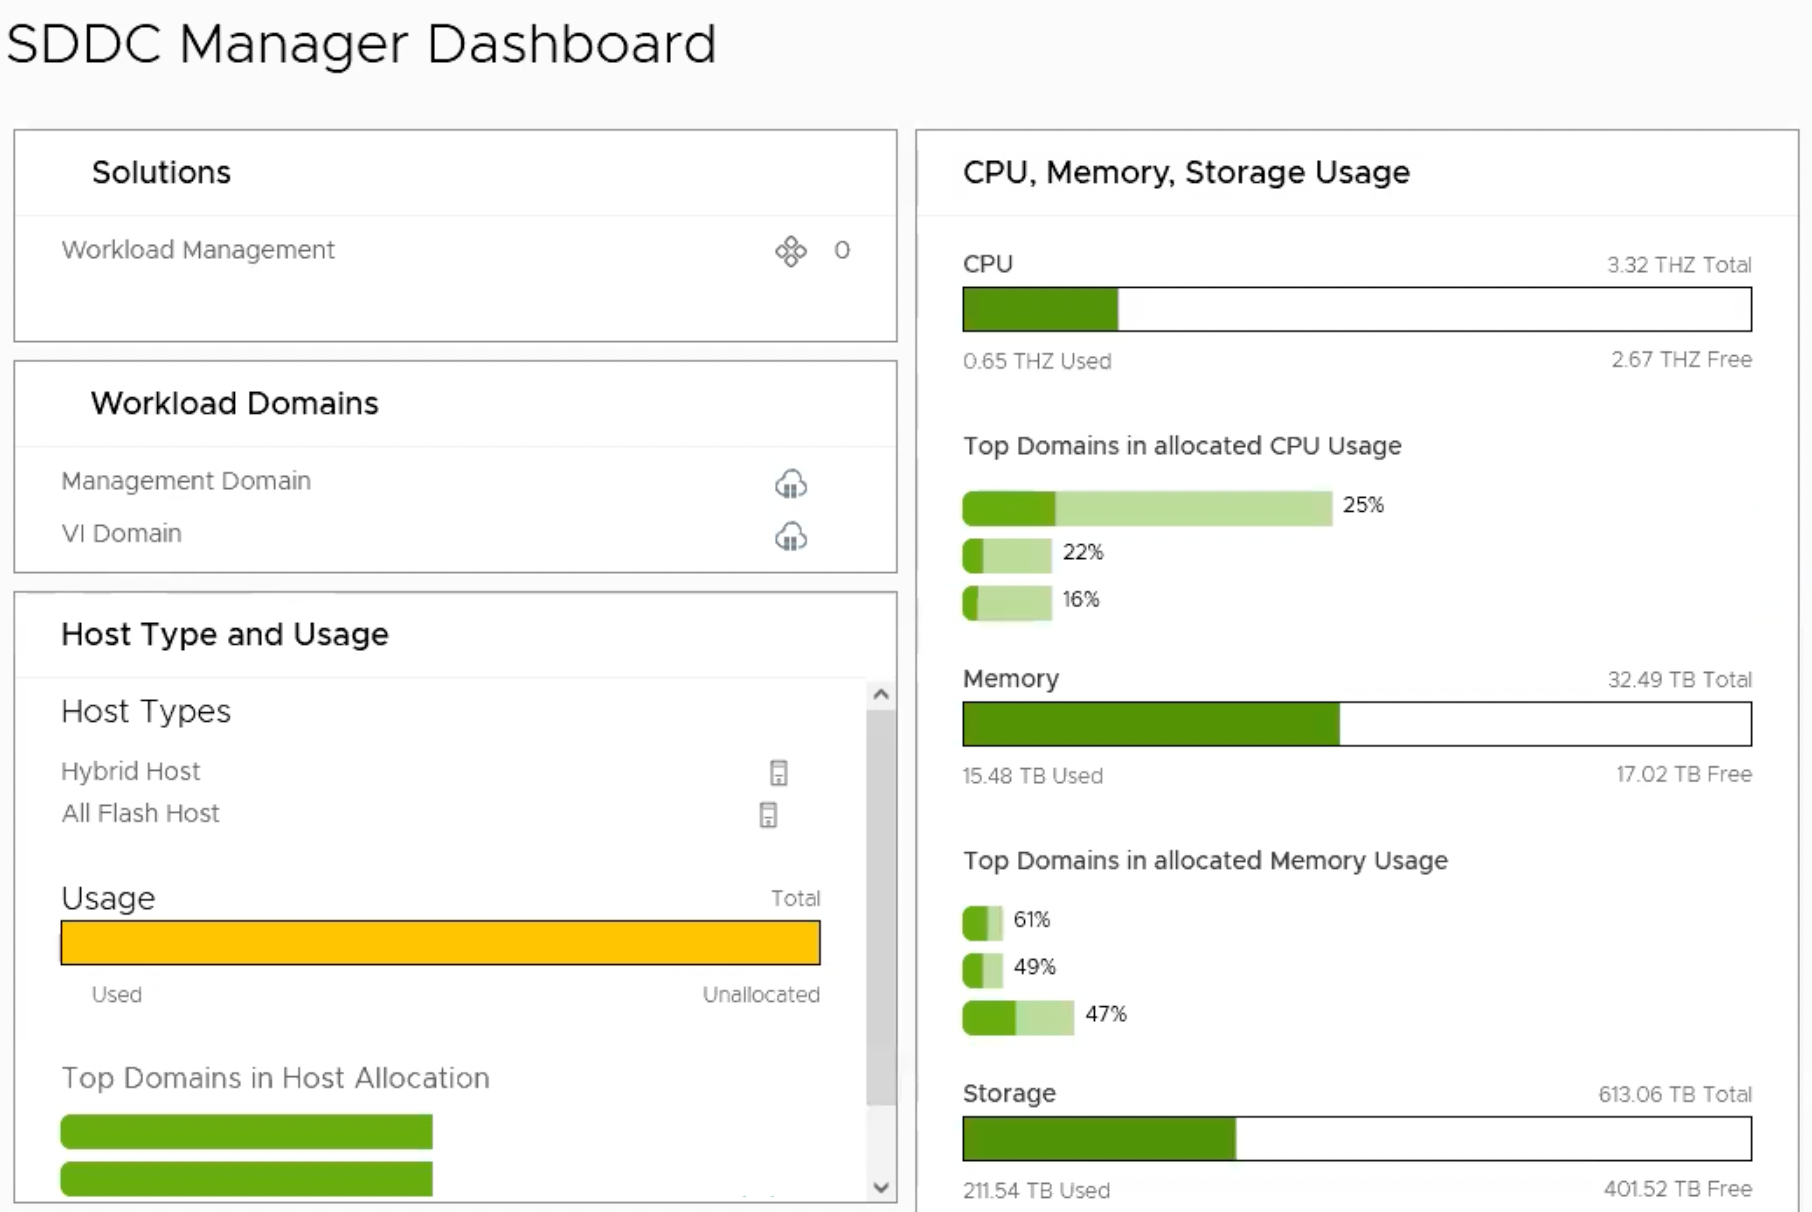
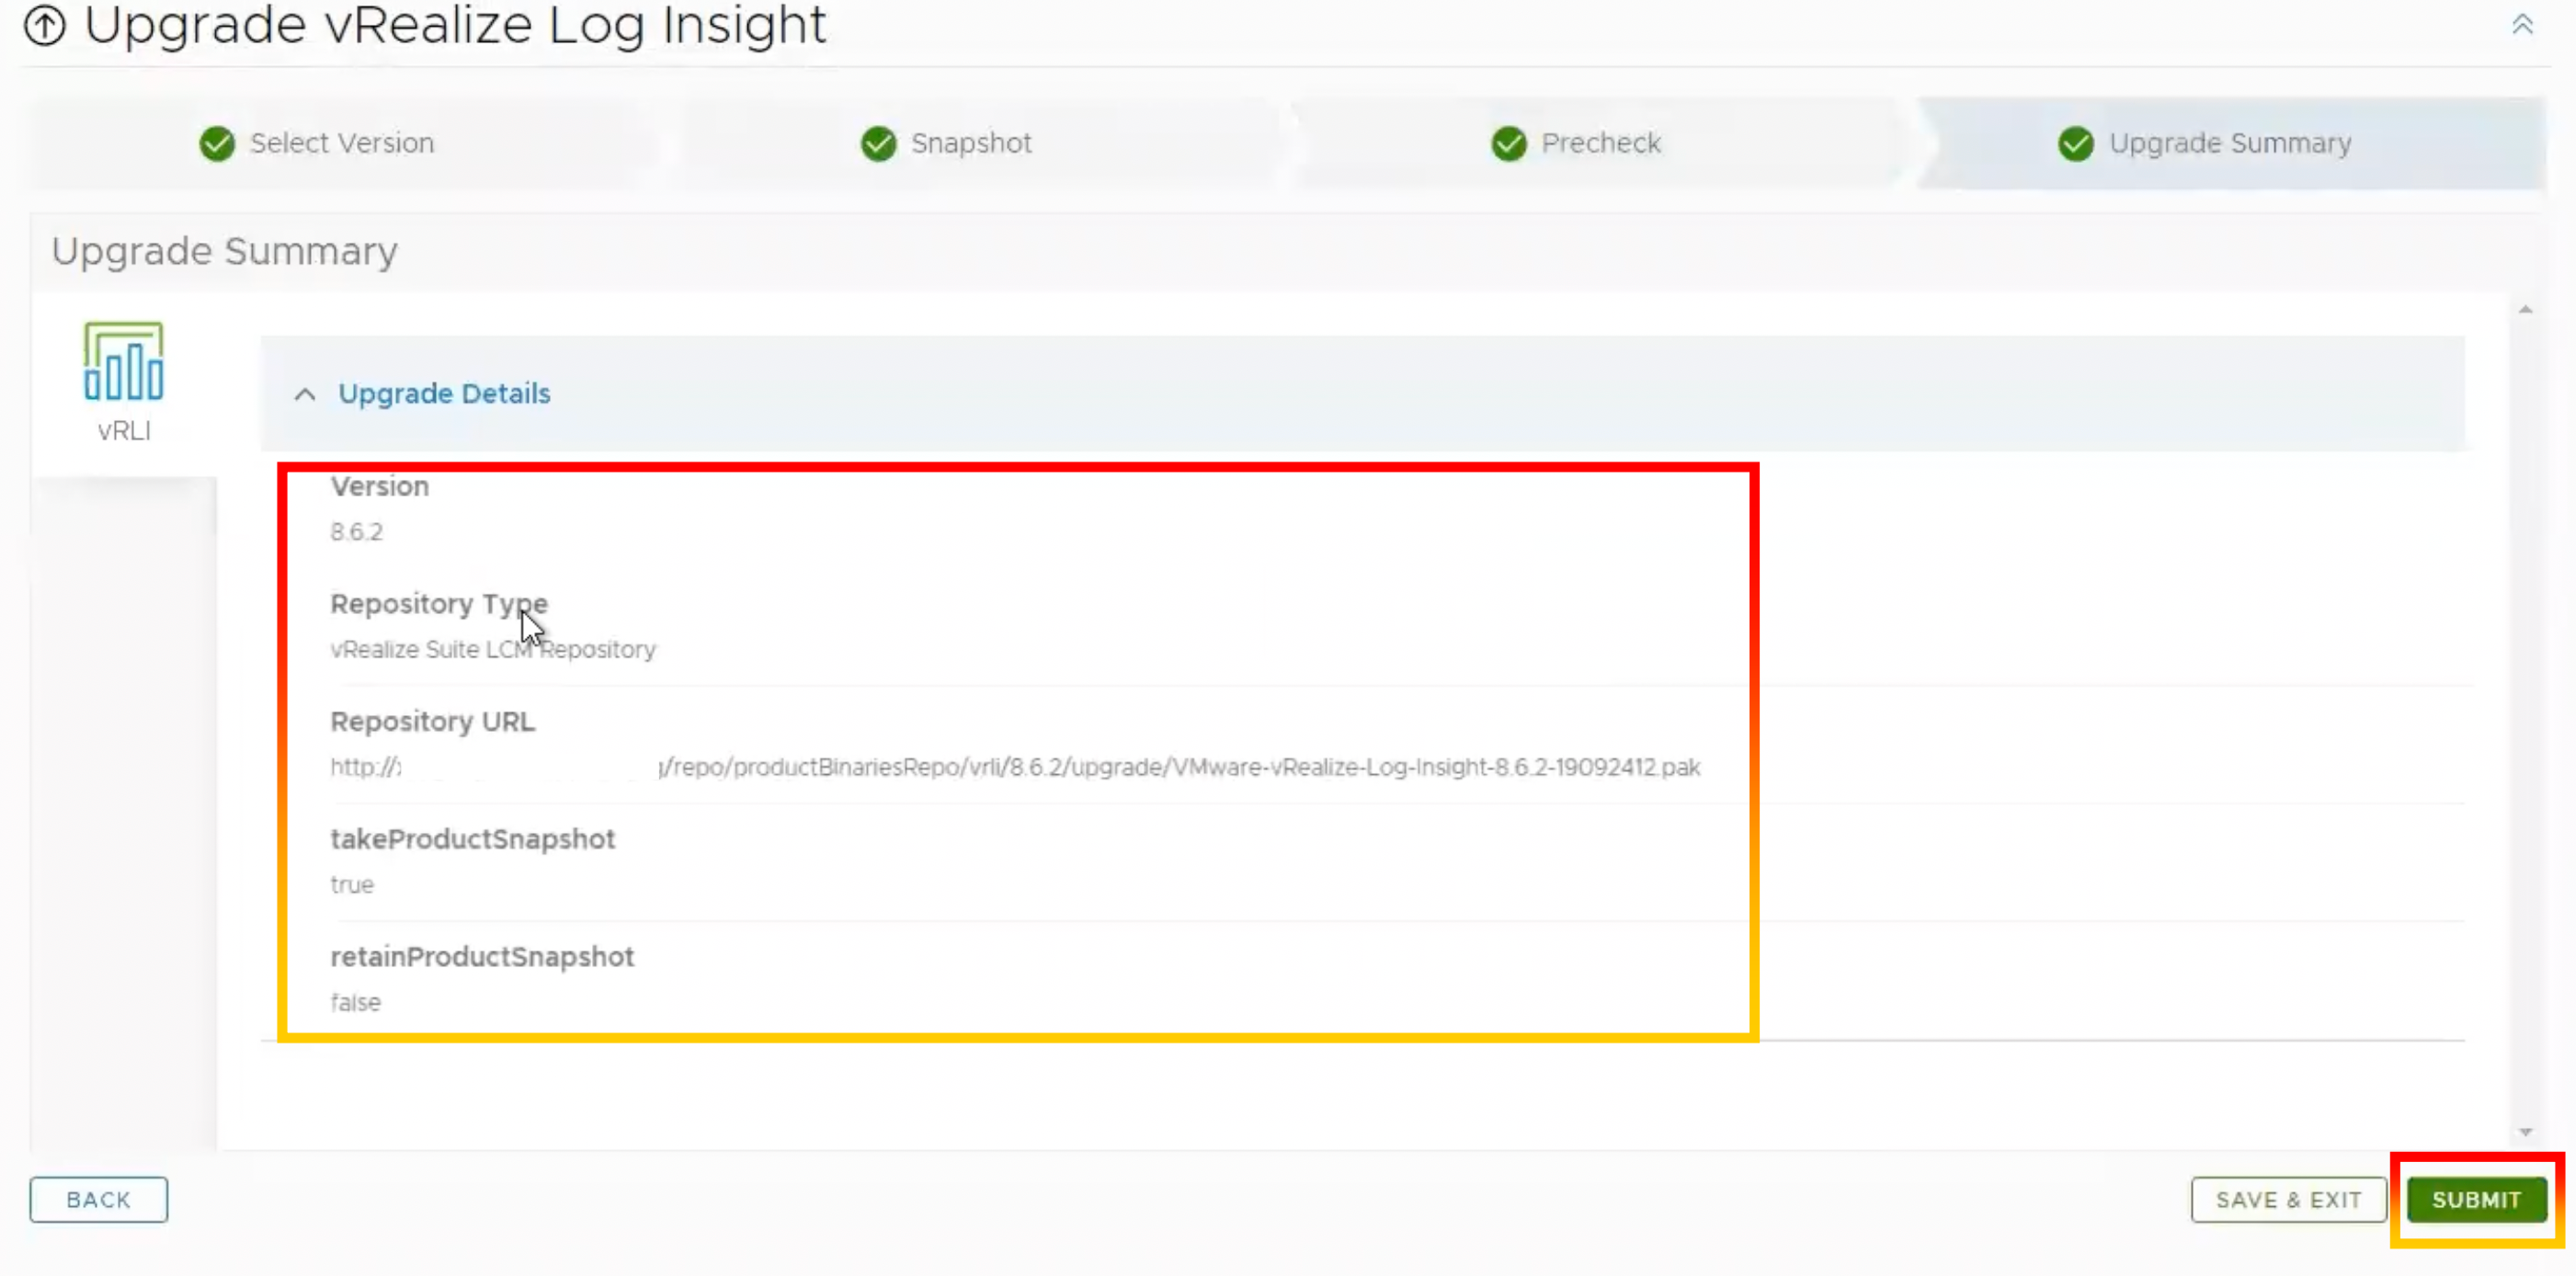
We intend to upgrade VMware Cloud Foundation (VCF) from 4.2.1 to 4.4.1.
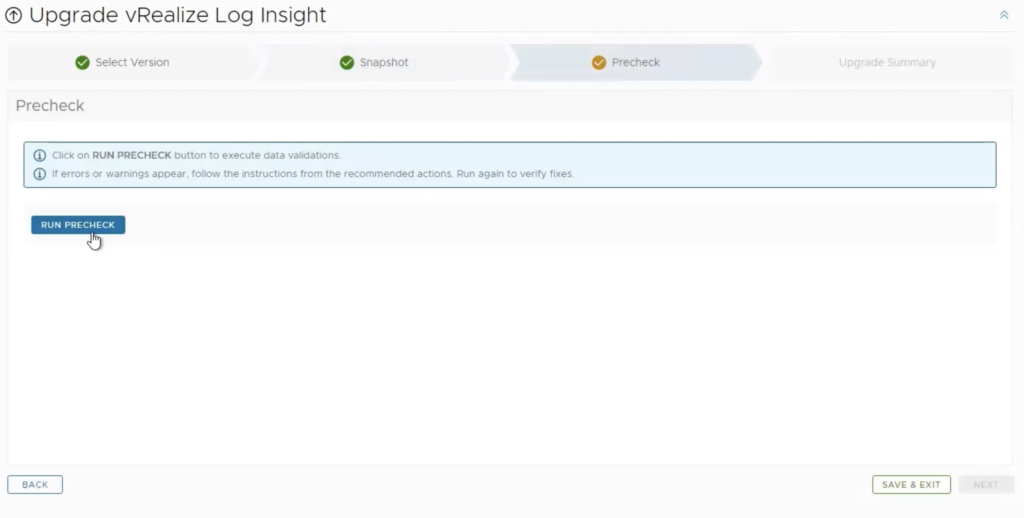
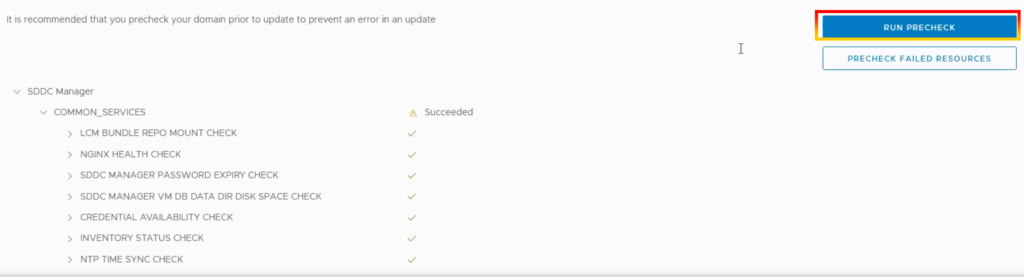
Before upgrading VCF, we must do a pre-check on all VCF components.

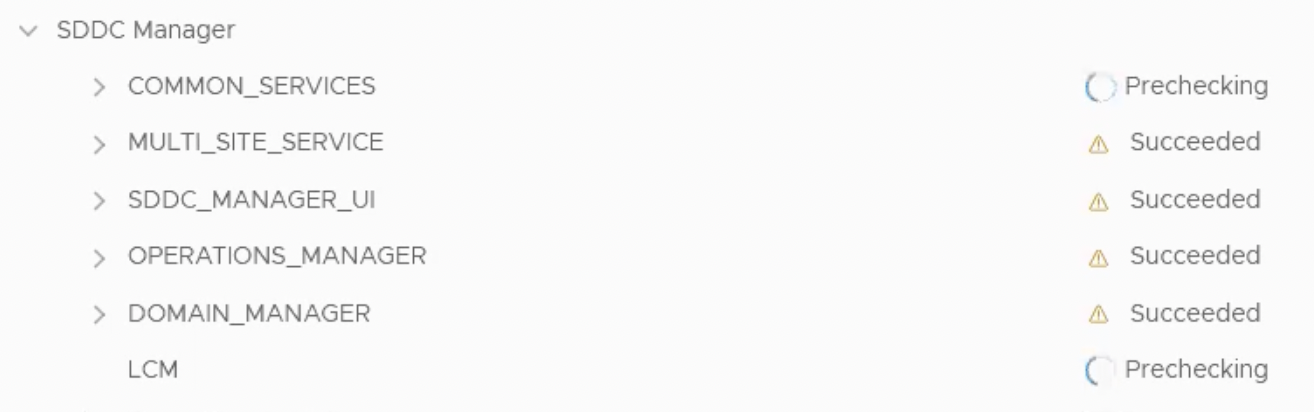
The pre-check begins with the SDDC manager.

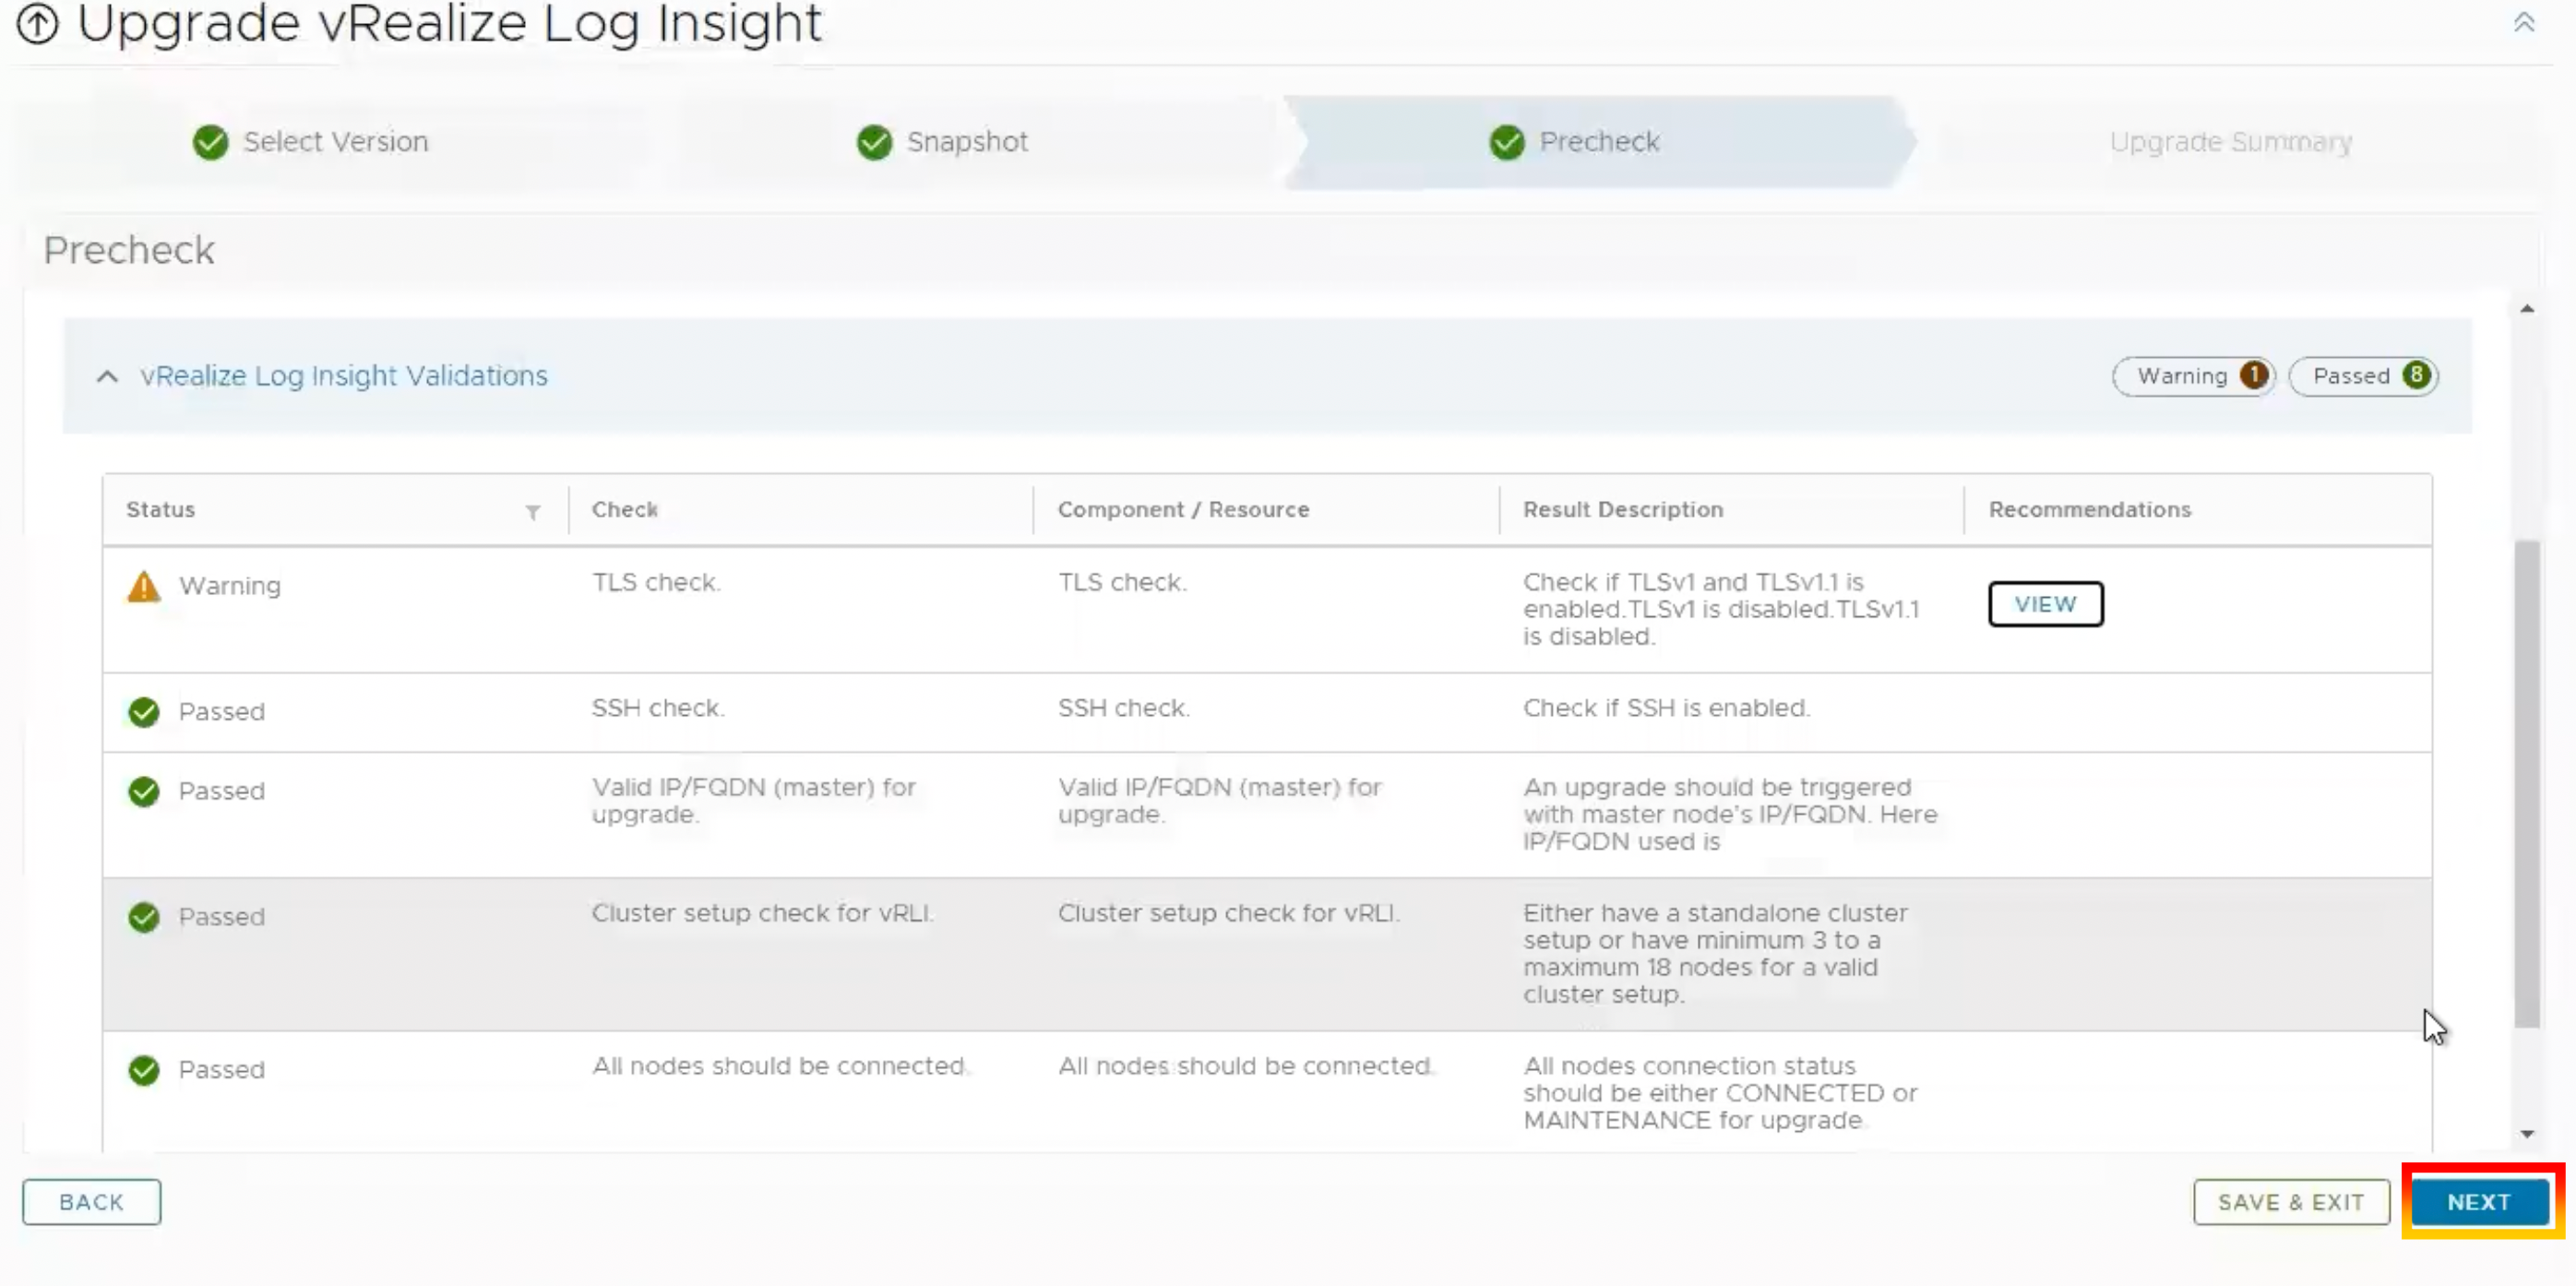
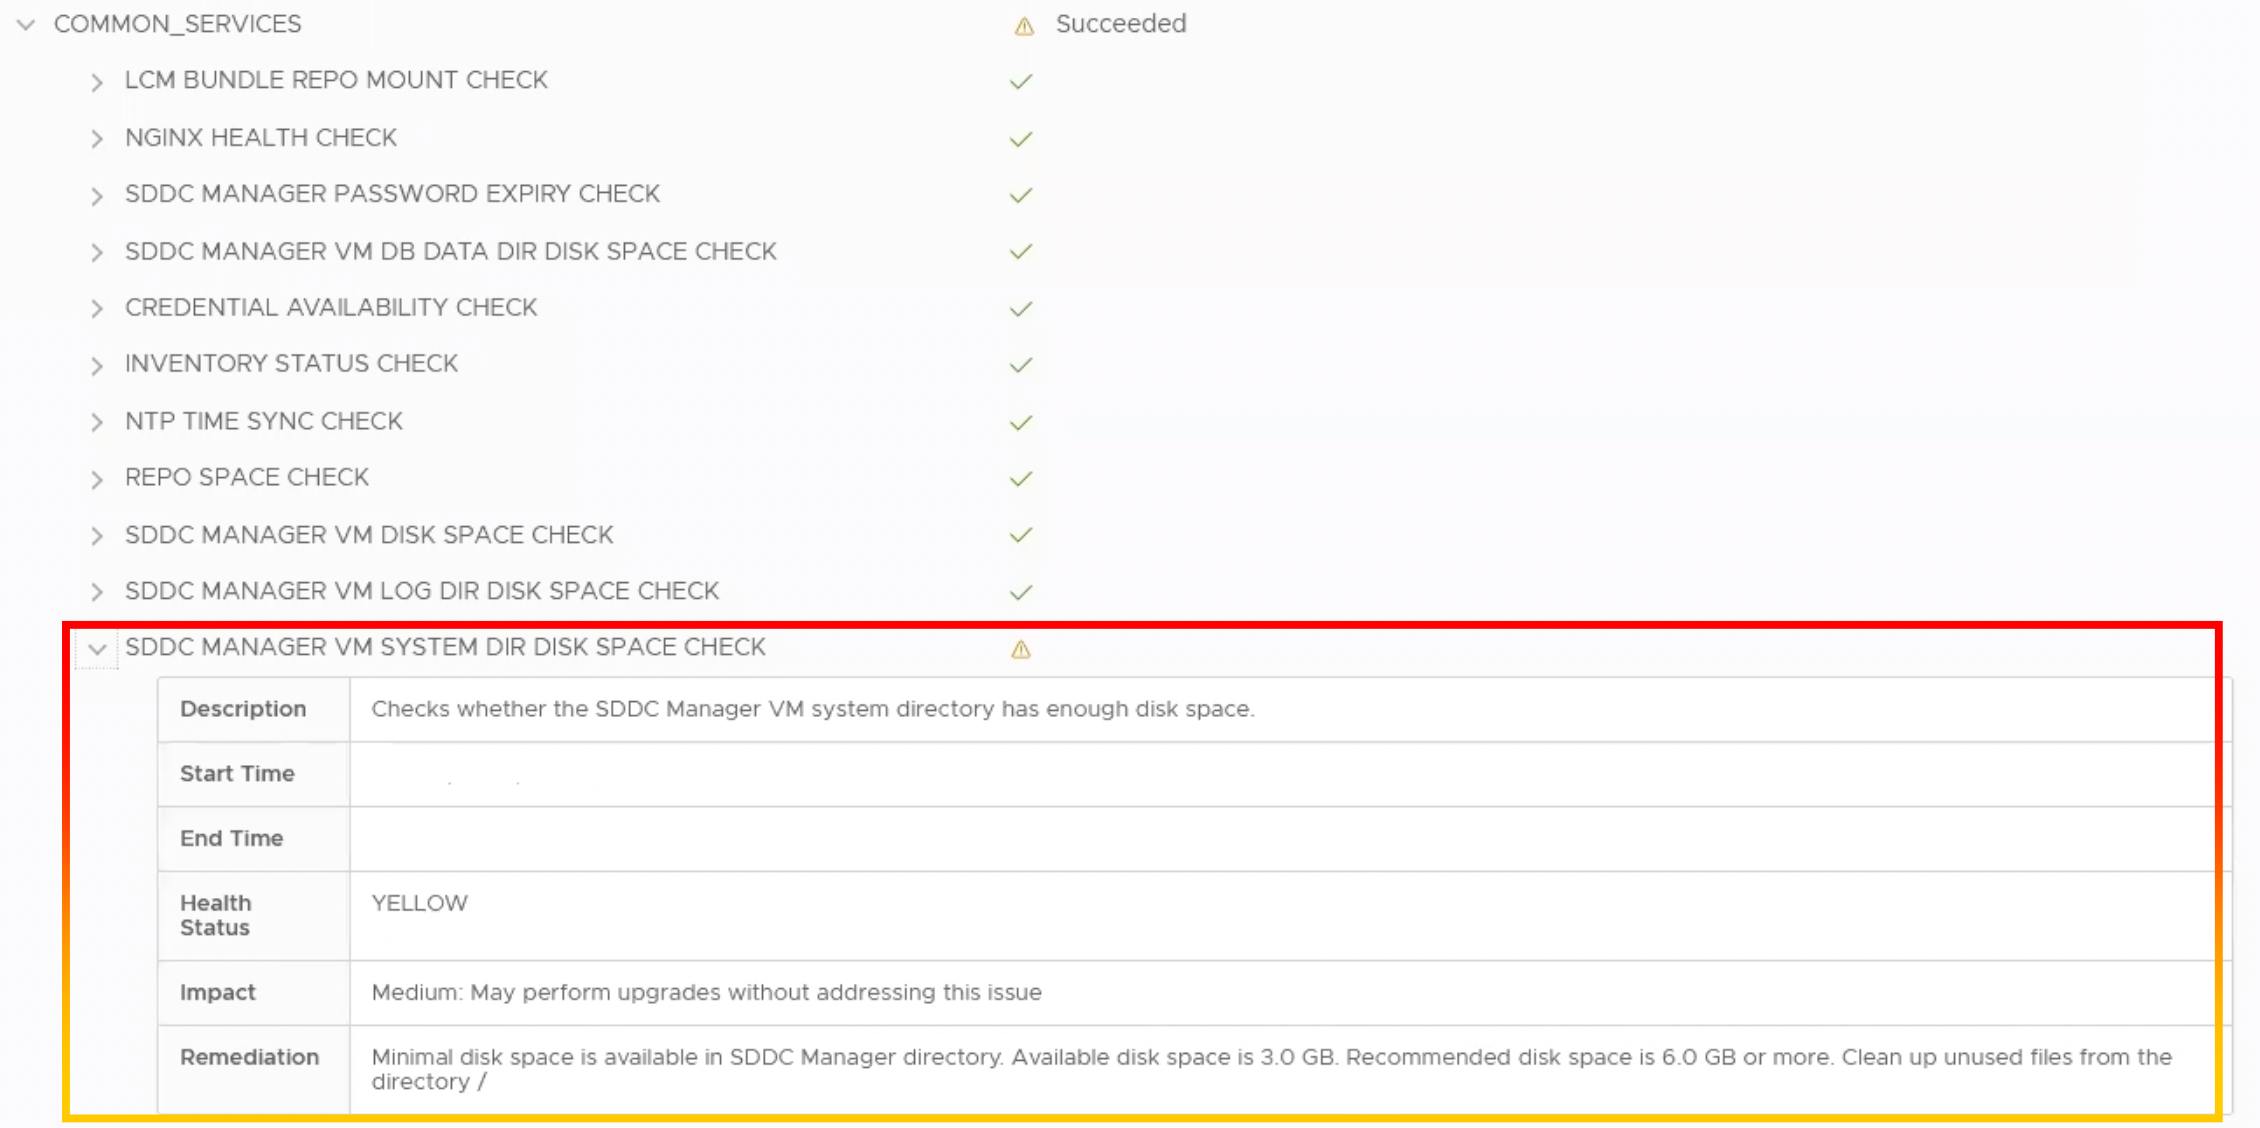
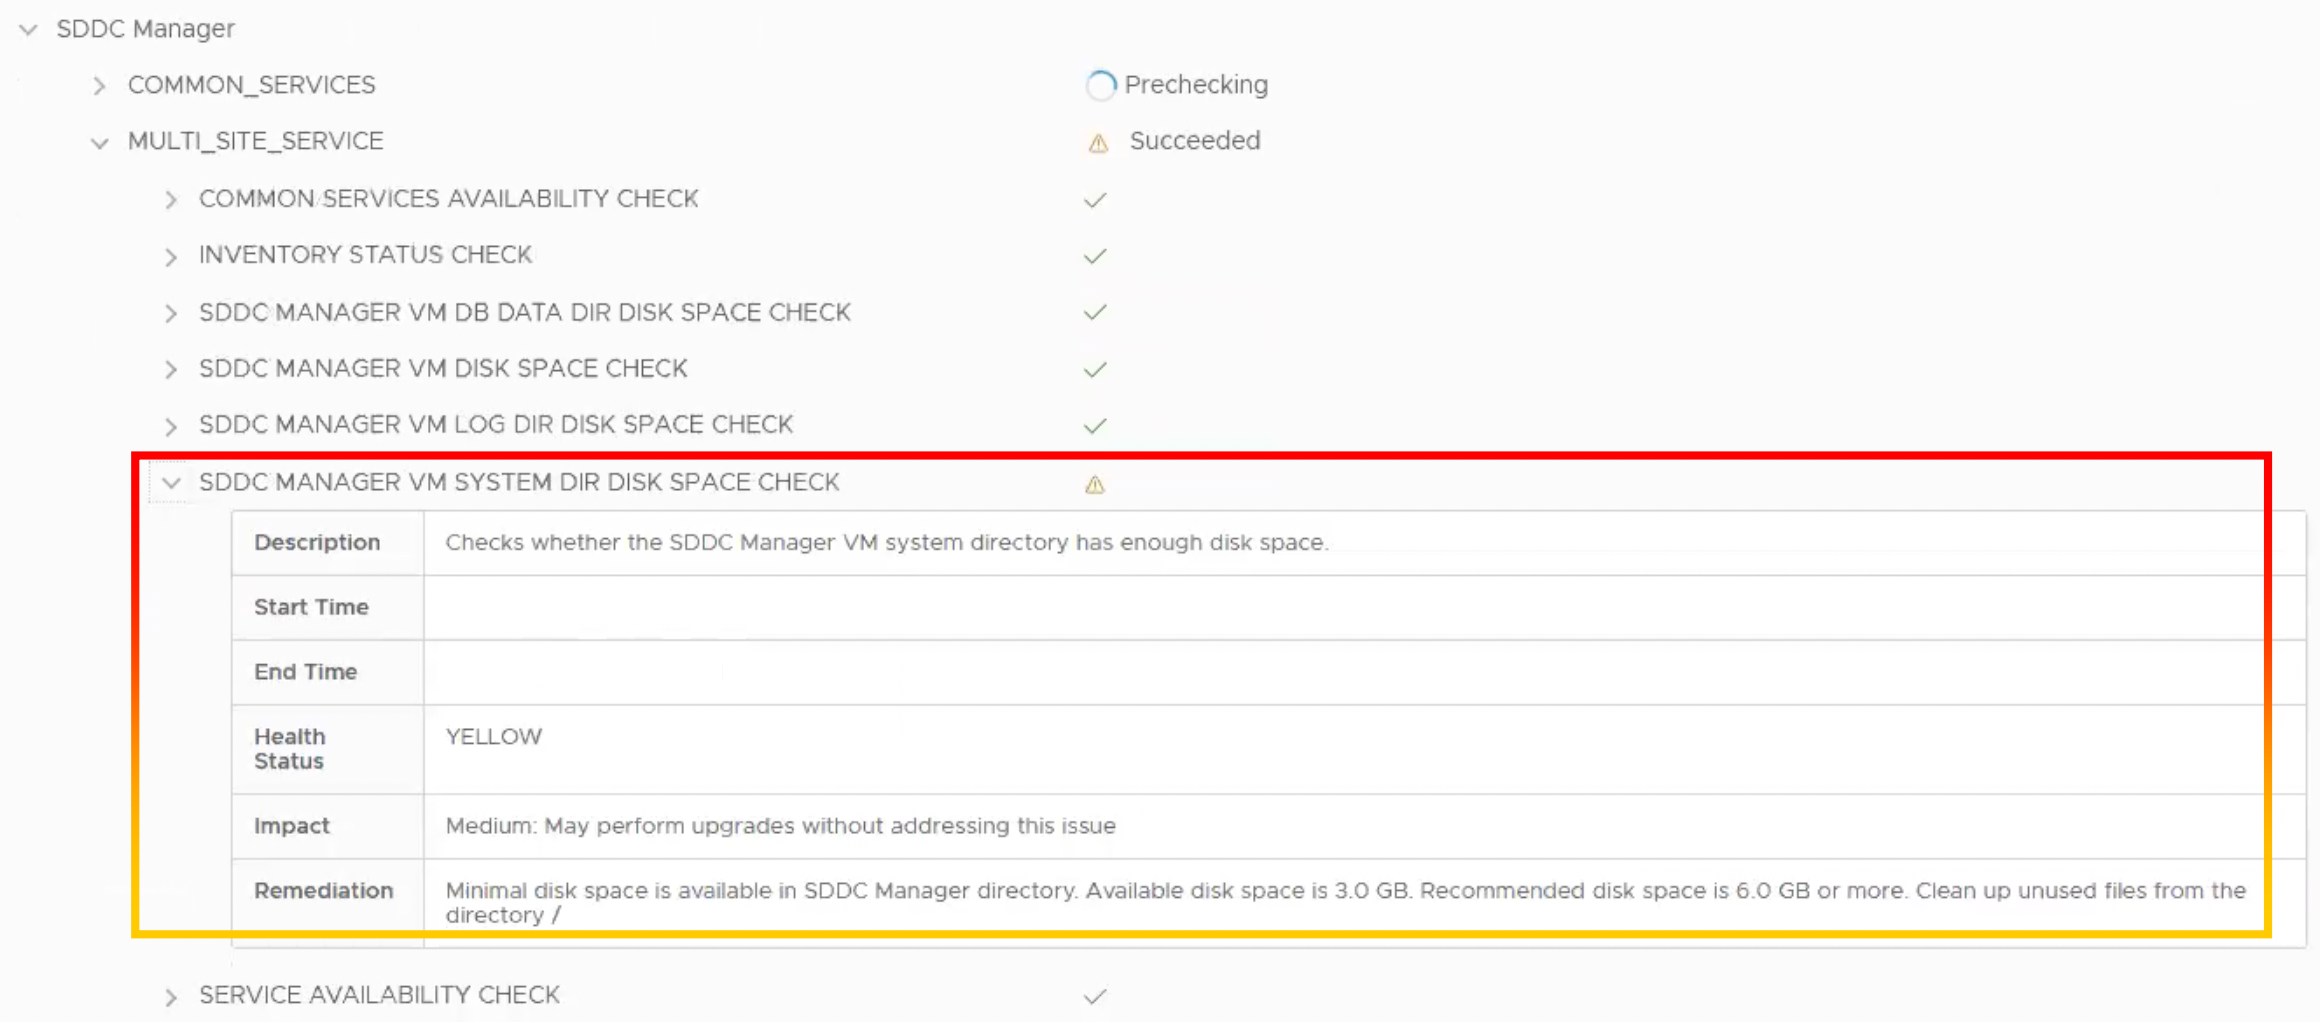
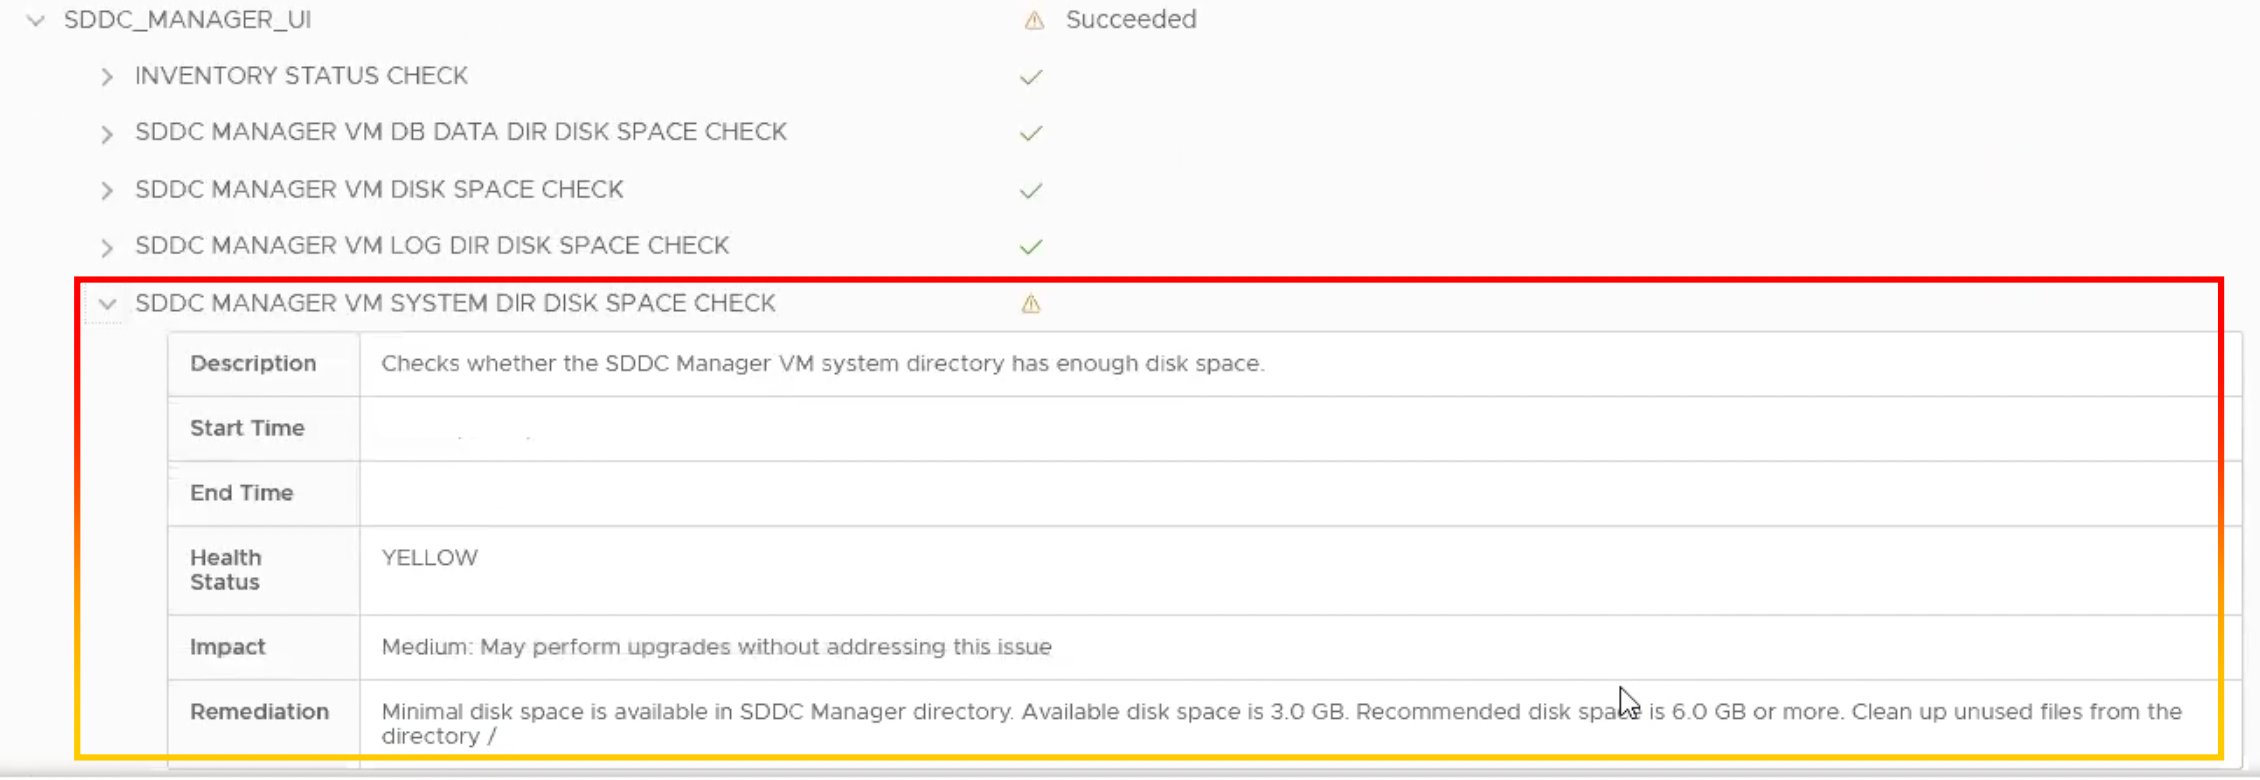
We noticed the warning “Checks whether the SDDC Manager VM system directory has enough disk space” during the SDDC manager pre-check.

DescriptionChecks whether the SDDC Manager VM system directory has enough disk space
Start Timexx/xx/xx
End Timexx/xx/xx
Health StatusYELLOW
ImpactMedium: May perform upgrades without addressing the issues
RemediationMinimal disk space is available in SDDC Manager directory Available disk space is 3.0 GB. Recommended disk space is 6.0 GB or more. Clean up unused files from the directory /

COMMON_SERVICES

MULTI_SITE_SERVICE

SDDC_MANAGER_UI

Steps to resolving these issues

The steps following do not require a reboot or restart of any SDDC Manager services.

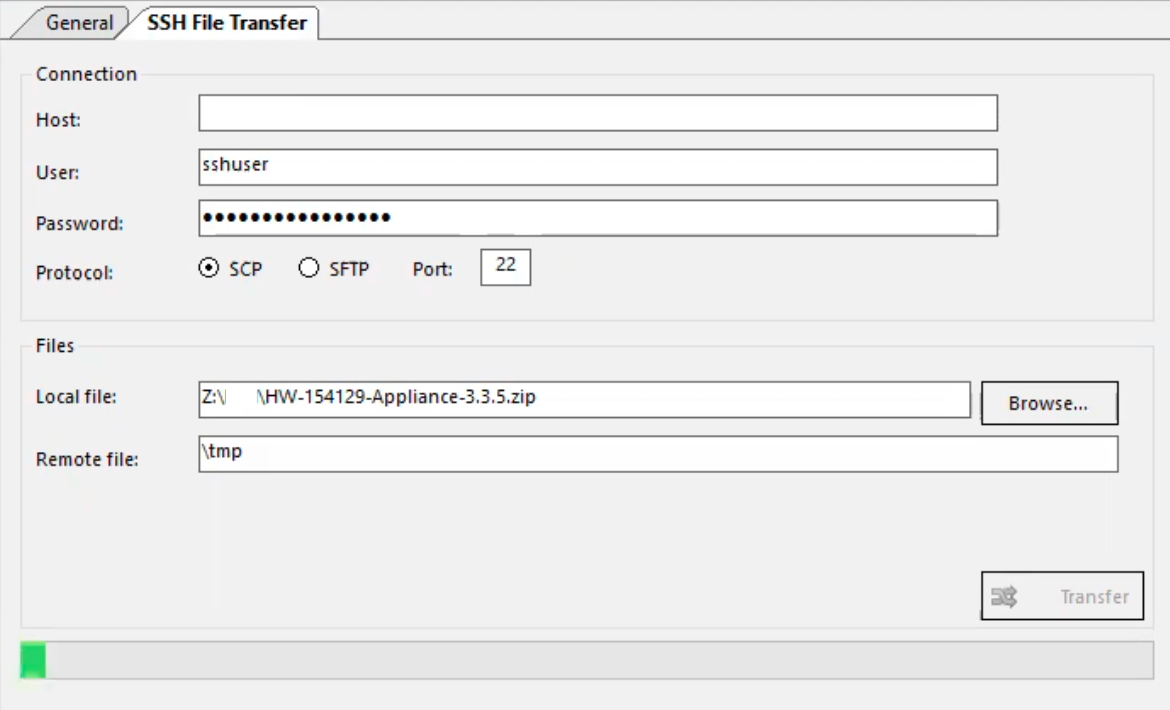
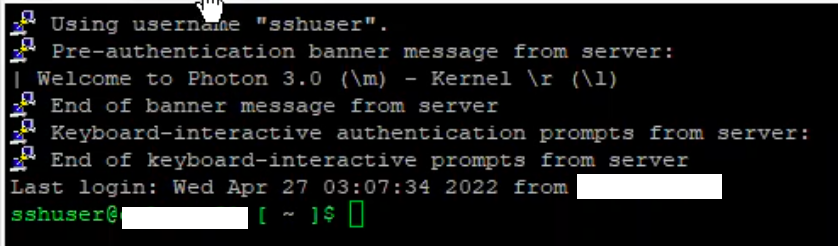
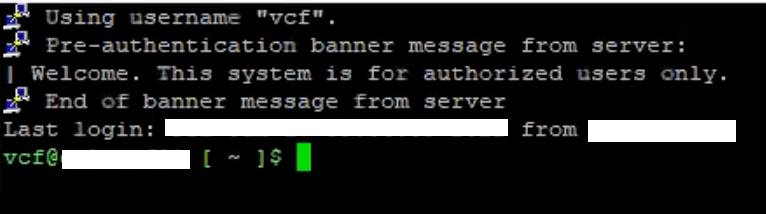
1.SSH into the SDDC Manager as the VCF user.

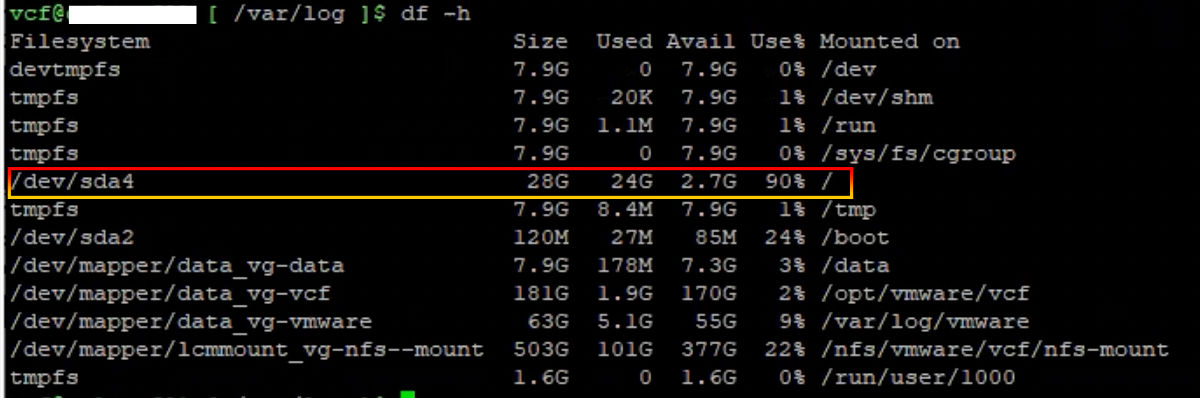
2.To display space, we navigate to /var/log and use the “df -h” command. We discovered a path. Use 90% Avail 2.7G for /dev/sda4.

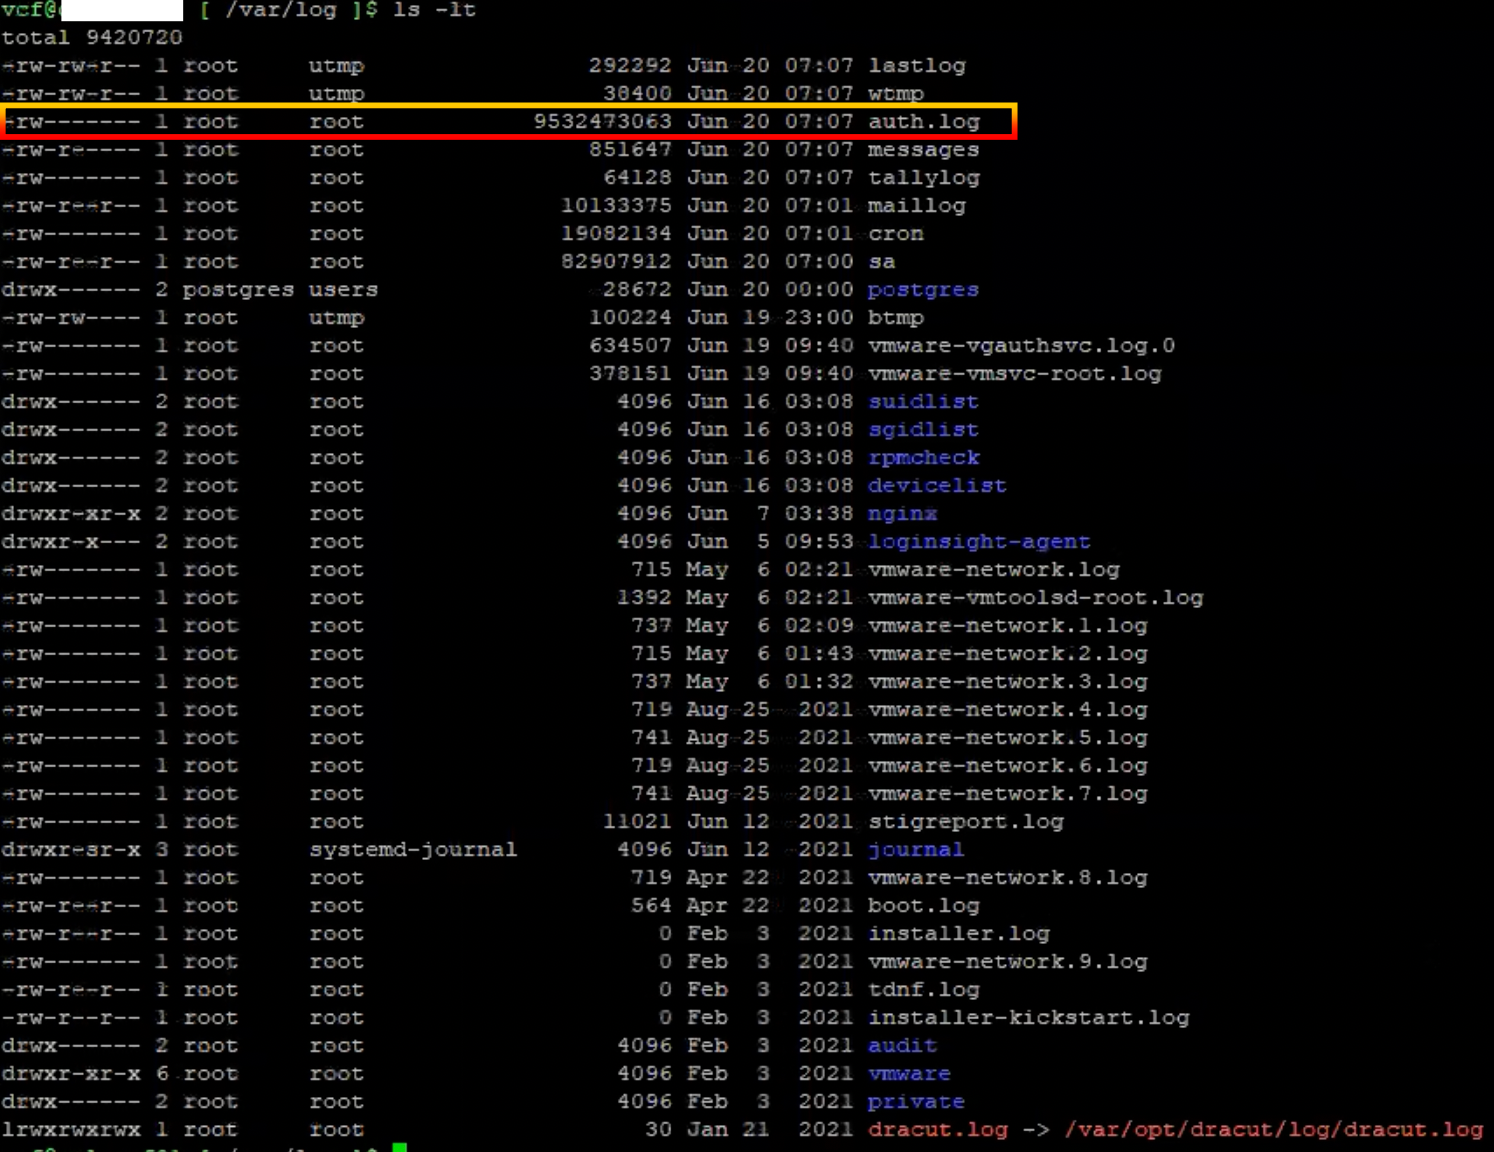
3.We used the command “ls -lt” to list in long format and sort by time and date. The file size of “auth.log” was 9.5GB.

4.To resolve this issue, we followed the blogs https://vinsanity.uk/2021/10/21/failed-pre-check-in-sddc-manager-error-disk-space-on-sddc-manager-vm-is-less-than-required/, but I will demonstrate for the specifics.

5.We must verify the file size in the audit log path.

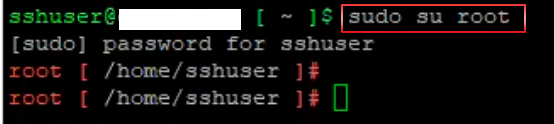
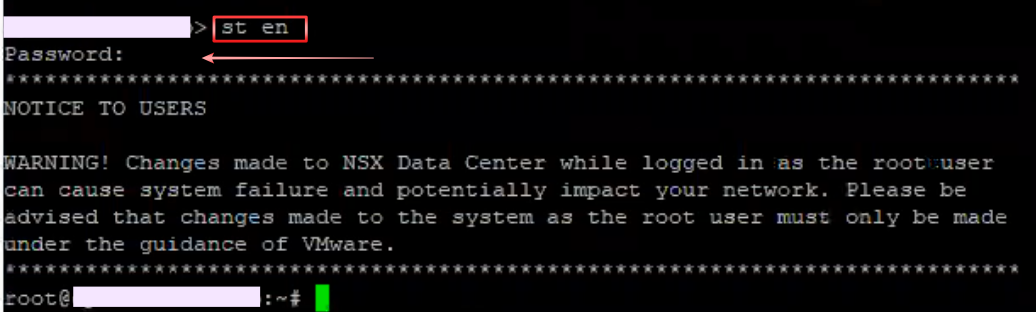
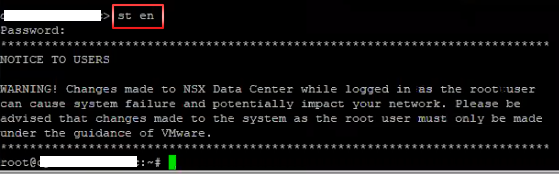
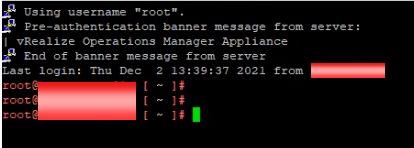
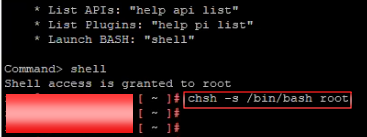
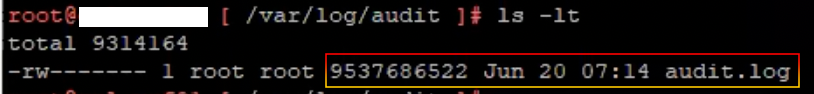
6.Log in as the root user.

7.Verify the file size of the audit log file. The file size of “audit.log” was 9.5GB.

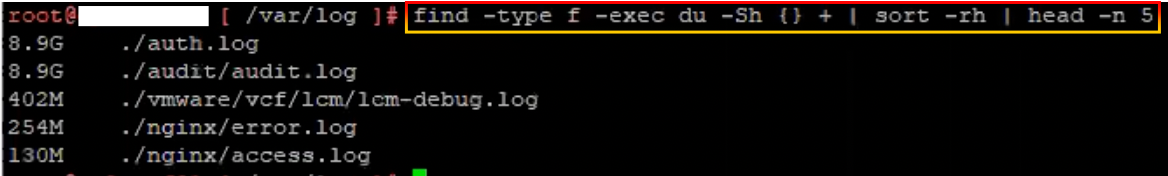
8.To identify and sort the large 5 files, use the command “find -type f -exec du -Sh {} + | sort -rh | head -n 5“.

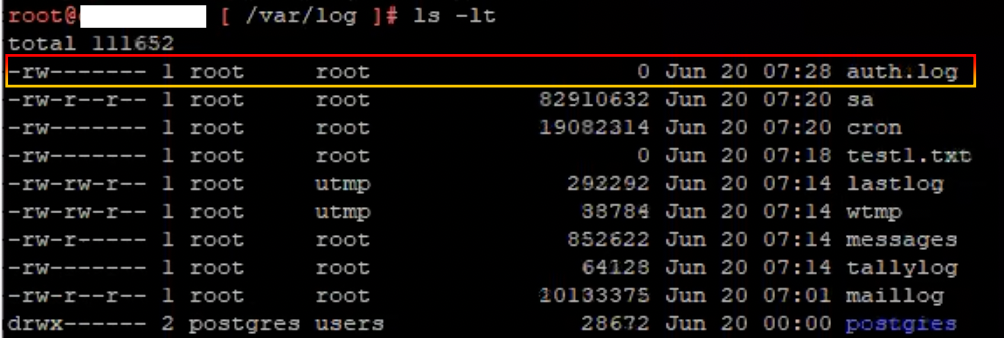
9. To clear the size of the auth.log file, use the command “> auth.log.“.

10.Verify the file size. Using the command “ls -lt,” we confirmed that the size of auth.log had been reduced.

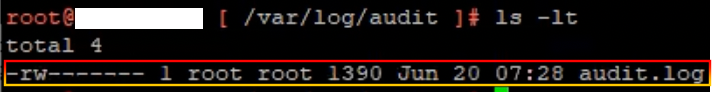
11.Navigate to the audit path “cd audit“.

12.Verify the file size in the audit path “ls -lt“.

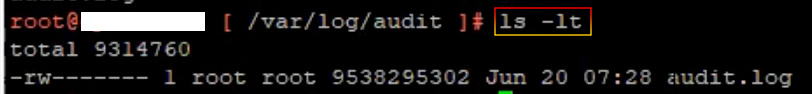
13.To clear the size of the audit.log file, use the command “> audit.log.

14.Verify the file size. Using the command “ls -lt,” we confirmed that the size of audit.log had been reduced.

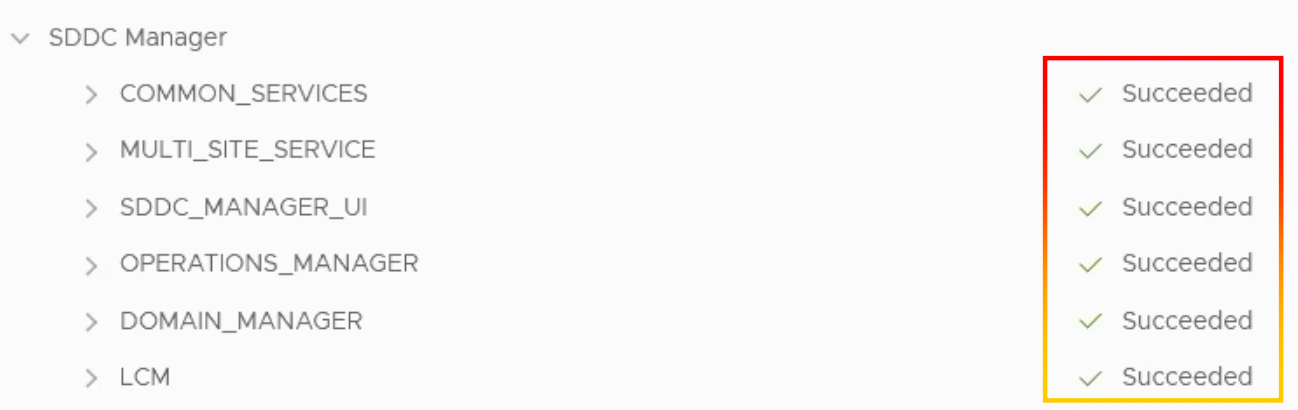
15.Return to SDDC Manager and execute the pre-check once again.

16.SDDC Manager’s components had all succeeded.

Conclusion

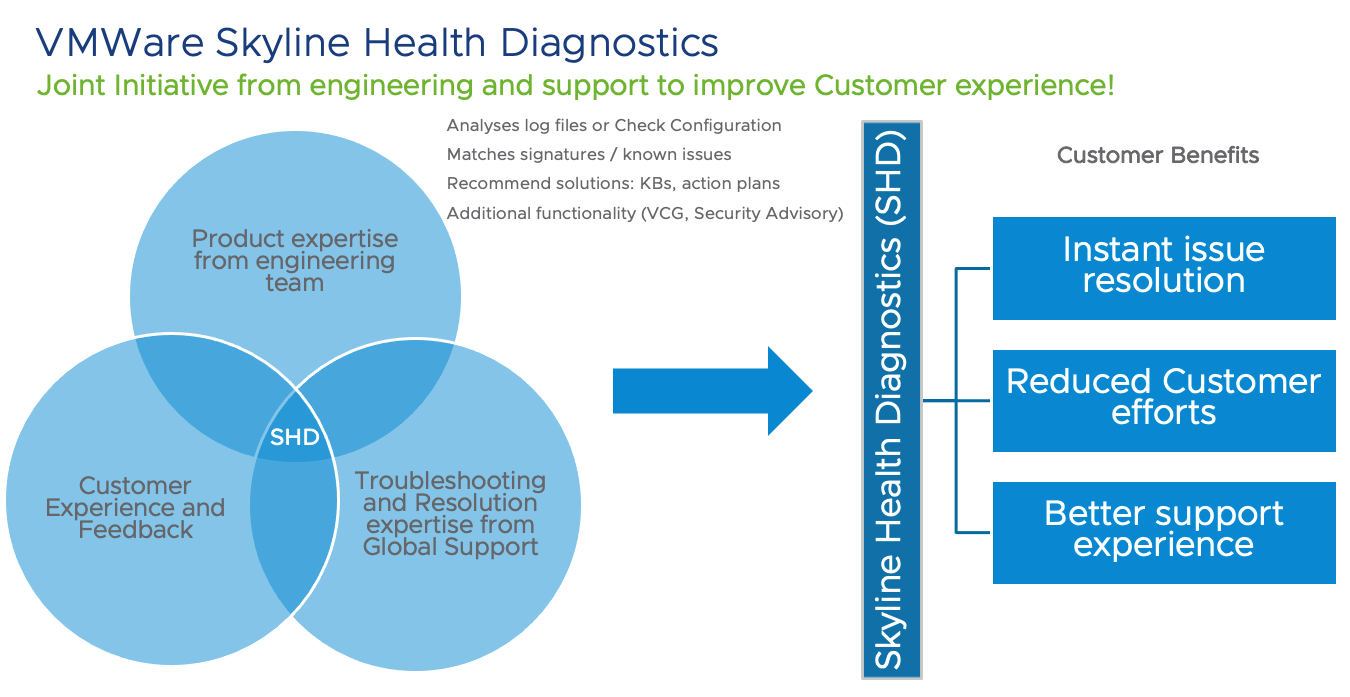
The SDDC Manager UI provides a single point of control for managing and monitoring your VMware Cloud Foundation instance and for provisioning workload domains. Before upgrading VCF, we recommend that you do a pre-check, and if you find any errors or warnings, please resolve them before proceeding with the update.

Reference

https://vinsanity.uk/2021/10/21/failed-pre-check-in-sddc-manager-error-disk-space-on-sddc-manager-vm-is-less-than-required/

Upgrade VMware vRealize Log Insight (vRLI) to 8.6.2 using vRSLCM 8.6.2

By Lerpong Intaraworrapath | 21st July 2022

This article will walk you through the process of upgrading VMware vRealize Log Insight (vRLI) from 8.4.0 to 8.6.2 using VMware vRealize Suite Lifecycle Manager (vRSLCM) version 8.6.2.

The current version of VMware vRealize Login Insight is 8.4.0-17828109.

3 vRealize Login Insights clusters have been configured in the environment.

STEP – How to upgrade VMware vRealize Log Insight (vRLI) to 8.6.2 by vRSLCM 8.6.2

Check and ADD Product version

1.Login to vRealize Suite Lifecycle Manager (vRSLCM) 8.6.2.

2.Navigate to “Binary Mapping” to upgrade the file for VMware vRealize Log Insight 8.6.2.

3.Click “ADD BINARIES” to get the most recent product version that supports vRSLCM 8.6.2.

4.Select “My VMware” and then click “DISCOVER“.

5.vRSLCM will find vRealize suite products supported by vRSLCM 8.6.2 by utilizing My VMware as configured.

6.Search for VMware vRealize Log Insight product upgrade and tick the box, then click “ADD“.

7. Click to check request status

8.Waiting for the status to change to “Completed“.

Upgrade VMware vRealize Log Insight to 8.6.2

1.Navigate to the environment you wish to upgrade, click “VIEW DETAILS“.

2.The details of vRealize Log Insight will be shown in the image below.

3.Before upgrading, we must sync the vRLI system with the vRSLCM. To do so, click the 3 dots () and then select “Trigger Inventory Sync“.

4.Click the “SUBMIT” button.

5.You will monitor the inventory sync progress at each stage and wait until the sync is complete.

6.After the inventory sync is complete, browse to the environment where vRealize Log Insight is deployed and select “UPGRADE“.

7.If the product’s inventory is already synced, we can proceed to upgrade; otherwise, we recommend clicking trigger inventory sync before proceeding.

8.The target product version 8.6.2 will be shown; click “NEXT“.

9.Check the box to take a snapshot, then click “NEXT”.

10.Pre-check for data validations prior to execution.

11.The status of vRealize Log Insight data validations is indicated below (if status show warning, we recommend to solve the issues before proceed to upgrade). We could collect the pre-check report.

12.Before proceeding with the update, review the information below and click “SUBMIT.”

13.You will notice each stage of vRLI upgrade and wait till it is completed.

14.Upgrade completed successfully.

vRealize Log Insight version 8.6.2-19092412

Check the vRLI version in vRSLCM.

Conclusion

VMware vRealize Suite Lifecycle Manager (vRSLCM) simplifies the deployment, patching, and upgrade process by performing automatic pre-checks and validation on vRealize Suite components.
Upgrading VMware vRealize Log Insight (vRLI) to the current version can assist you in resolving known issues, fixing bugs, and providing security in your environment.

VMware vRealize Automation – Logins to the UI intermittently fail with 502 Bad Gateway

By Lerpong Intaraworrapath | May 17th, 2022

ใน VMware vRealize Automation version 8.5.x เราจะพบว่า ในบางครั้ง เมื่อเรา Login เข้าไปที่ vRealize Automation portal จะไม่สามารถเข้าไปใช้งานได้ จะเจอ ข้อความ “ClientResponse has erroneous status code: 502 Bad Gateway

Symptoms:

ใน VMware vRealize Automation version 8.5.x หรือหลังจาก ทำการ upgrade to version 8.5.x เมื่อเรา login ในหน้า UI จะเกิด intermittently fails และ services logs contain 502 Bad Gateway exception เนื่องจาก พยายามจะ acquire access tokens from Identity service.

Errors from the identity-service within the identity-service-app-xxxxxxxxx-xxxxx pod contains errors similar to

2021-09-02T13:42:30.824Z ERROR identity-service [host='identity-service-app-9b97cb5f7-n9mdv' thread='reactor-http-epoll-1' user='' org='' trace='4e2d69fb-b884-4ba0-8ca3-60913ce5c830'] reactor.netty.http.server.HttpServer.error:319 - [id:0xa55a54c7,L:/10.244.0.128:8080 - R:/10.244.0.126:45626] 
java.io.UncheckedIOException: java.nio.file.FileSystemException: /tmp/synchronoss-file-upload-1080171699777

เมื่อเรา Login vRealize Automation portal จะแสดงผล Error ดังภาพ.

Resolution:

Issues ที่เกิดขึ้น จะแก้โดยใช้ VMware KB86121

https://kb.vmware.com/s/article/86121

Prerequisites:

ทำการ Create snapshot vRealize Automation appliance โดย without memory snapshot

Procedure:

1.ทำการ SSH / PuTTy ไปที่ appliance ตัวใดตัวนึงของ vRA cluster ด้วย user “root”.

2.Run the following command
echo 'IyEvYmluL2Jhc2gKCmlmIFsgIiQoY2F0IC9vcHQvc2NyaXB0cy9zdGF0ZV9lbmZvcmNlbWVudC5zaCB8IGdyZXAgImNsZWFudXBfaWRlbnRpdHlfcG9kc191bnVzZWRfZGlycyIgfCB3YyAtbCkiID09ICIxIiBdCnRoZW4KICAgIGVjaG8gIlRoZSBLQiBmb3IgY2xlYW51cCBvZiB1bnVzZWQgZGlycyBpbiBpZGVudGl0eSBwb2RzIGlzIGFscmVhZHkgYXBwbGllZC4iCiAgICBleGl0IDAKZmkKCnZyYWNsaSBjbHVzdGVyIGV4ZWMgLS0gYmFzaCAtYyAiZWNobyAnSXlFdlltbHVMMkpoYzJnS0NpTWdRMjl3ZVhKcFoyaDBJQ2hqS1NBeU1ESXhJRlpOZDJGeVpTd2dTVzVqTGlBZ1FXeHNJSEpwWjJoMGN5QnlaWE5sY25abFpDNEtJd29qSUZSb2FYTWdZMjlrWlNCcGN5Qm1iM0lnZFhObElHWnliMjBnWW5WcGJIUXRhVzRnWVhWMGIyMWhkR2xqSUhONWMzUmxiWE11SUVSdklHNXZkQ0JqWVd4c0lHbDBJR1p5YjIwS0l5QXpjbVFnY0dGeWRIa2djM2x6ZEdWdGN5d2djbVYxYzJVZ2IzSWdjbVZ3Y205a2RXTmxMZ29qQ2dvaklGUm9hWE1nYzJOeWFYQjBJR2x6SUc5dWJIa2dZWEJ3YkdsallXSnNaU0JtYjNJZ2RsSkJJRGd1TlNCSFFTQjJaWEp6YVc5dUlHRnVaQ0JwZENCemFHOTFiR1FnYm05MElHSmxJSFZ6WldRZ2IyNGdZVzU1SUc5MGFHVnlJSFpTUVNCMlpYSnphVzl1Y3k0S0NtWjFibU4wYVc5dUlHeHZaeWdwSUhzS0lDQnNiMk5oYkNCdGMyYzlJaVF4SWdvZ0lHeHZZMkZzSUd4bGRtVnNQU0lrTWlJS0lDQnNiMk5oYkNCa2REMGtLR1JoZEdVZ0p5c2xXUzBsYlMwbFpDQWxTRG9sVFRvbFV5Y3BDZ29nSUdWamFHOGdJbHNrYkdWMlpXeGRXeVJrZEYwZ0pHMXpaeUlLZlFvS1puVnVZM1JwYjI0Z2JHOW5YMmx1Wm04b0tTQjdDaUFnYkc5bklDSWtNU0lnSWtsT1JrOGlDbjBLQ25ObGRDQXJaUW9LYkc5blgybHVabThnSWtOc1pXRnVhVzVuSUhWd0lHbGtaVzUwYVhSNUlIQnZaSE1nZFc1MWMyVmtJR1JwY25NdUxpNGlDbWxtSUZzZ0xXWWdMM1poY2k5MmJYZGhjbVV2Y0hKbGJIVmtaUzlwWkdWdWRHbDBlUzF6ZG1NdmJHRnpkQzFqYkdWaGJuVndJRjBLZEdobGJnb2dJR2xtSUZzZ0lpUW9abWx1WkNBdmRtRnlMM1p0ZDJGeVpTOXdjbVZzZFdSbEwybGtaVzUwYVhSNUxYTjJZeThnTFc1aGJXVWdiR0Z6ZEMxamJHVmhiblZ3SUMxMGVYQmxJR1lnTFcxdGFXNGdMVGN5TUNCOElIZGpJQzFzS1NJZ1BUMGdJakVpSUYwS0lDQjBhR1Z1Q2lBZ0lDQnNiMmRmYVc1bWJ5QWlTV1JsYm5ScGRIa2djMlZ5ZG1salpTQnplVzVqYUhKdmJtOXpjeTBxSUhOMVltUnBjbVZqZEc5eWFXVnpJR2hoZG1VZ1lXeHlaV0ZrZVNCaVpXVnVJR05zWldGdVpXUWdkWEFnYVc0Z2RHaGxJSEJoYzNRZ01USWdhRzkxY25NdUlnb2dJQ0FnWlhocGRDQXdDaUFnWm1rS1pta0tDbWxrWlc1MGFYUjVYM05sY25acFkyVmZjRzlrYzE5c2FXNWxQU1FvYTNWaVpXTjBiQ0JuWlhRZ2NHOWtjeUF0YmlCd2NtVnNkV1JsSUMxc0lHRndjRDFwWkdWdWRHbDBlUzF6WlhKMmFXTmxMV0Z3Y0NBdExXOTFkSEIxZEQxcWMyOXVjR0YwYUQxN0xtbDBaVzF6TGk1dFpYUmhaR0YwWVM1dVlXMWxmU2tLQ2tsR1V6MG5JQ2NnY21WaFpDQXRjaUF0WVNCd2IyUnpJRHc4UENBaUpHbGtaVzUwYVhSNVgzTmxjblpwWTJWZmNHOWtjMTlzYVc1bElnb0tabTl5SUhCdlpDQnBiaUFpSkh0d2IyUnpXMEJkZlNJS1pHOEtJQ0FnSUdsa1pXNTBhWFI1WDNCdlpGOXpkR0YwZFhNOUpDaHJkV0psWTNSc0lHZGxkQ0J3YjJSeklDMXVJSEJ5Wld4MVpHVWdJaVJ3YjJRaUlDMHRiM1YwY0hWMFBXcHpiMjV3WVhSb1BYc3VjM1JoZEhWekxuQm9ZWE5sZlNrS0NpQWdJQ0JwWmlCYklDSlNkVzV1YVc1bklpQTlQU0FpSkdsa1pXNTBhWFI1WDNCdlpGOXpkR0YwZFhNaUlGMEtJQ0FnSUhSb1pXNEtJQ0FnSUNBZ0lDQWpJRVJsYkdWMFpTQnpkV0lnWkdseWN5QnBiaUF2ZEcxd0lHOXNaR1Z5SUhSb1lXNGdNaUJvYjNWeWN3b2dJQ0FnSUNBZ0lHeHZaMTlwYm1adklDSkVaV3hsZEdsdVp5QjFiblZ6WldRZ1pHbHljeUJtY205dElDUndiMlFpQ2lBZ0lDQWdJQ0FnYTNWaVpXTjBiQ0JsZUdWaklDMXBkQ0F0YmlCd2NtVnNkV1JsSUNJa2NHOWtJaUF0TFNCbWFXNWtJQzkwYlhBZ0xXNWhiV1VnSjNONWJtTm9jbTl1YjNOektpY2dMVzF0YVc0Z0t6RXlNQ0F0WkdWc1pYUmxJREkrTDJSbGRpOXVkV3hzSUh4OElIUnlkV1VLSUNBZ0lHWnBDbVJ2Ym1VS0NuWnlZV05zYVNCamJIVnpkR1Z5SUdWNFpXTWdMUzBnWW1GemFDQXRZeUFpYld0a2FYSWdMWEFnTDNaaGNpOTJiWGRoY21VdmNISmxiSFZrWlM5cFpHVnVkR2wwZVMxemRtTTdJSFJ2ZFdOb0lDOTJZWEl2ZG0xM1lYSmxMM0J5Wld4MVpHVXZhV1JsYm5ScGRIa3RjM1pqTDJ4aGMzUXRZMnhsWVc1MWNDSUtDZz09JyB8IGJhc2U2NCAtZCA+IC9vcHQvc2NyaXB0cy8yODMzMTYxX2NsZWFudXBfaWRlbnRpdHlfcG9kc191bnVzZWRfZGlycy5zaCAmJiBjaG1vZCAreCAvb3B0L3NjcmlwdHMvMjgzMzE2MV9jbGVhbnVwX2lkZW50aXR5X3BvZHNfdW51c2VkX2RpcnMuc2g7IGVjaG8gJy9vcHQvc2NyaXB0cy8yODMzMTYxX2NsZWFudXBfaWRlbnRpdHlfcG9kc191bnVzZWRfZGlycy5zaCcgPj4gL29wdC9zY3JpcHRzL3N0YXRlX2VuZm9yY2VtZW50LnNoIgoK' | base64 -d > /root/kb-identity-pods-cleanup.sh && chmod +x /root/kb-identity-pods-cleanup.sh && /root/kb-identity-pods-cleanup.sh && rm /root/kb-identity-pods-cleanup.sh

Validate the change:

1. Verify the shell script “/opt/scripts/cleanup_identity_pods_unused_dirs.sh” exists on each appliance in the cluster.

2. Verify the shell script “/opt/scripts/state_enforcement.sh” contains the following in the last line
cat /opt/scripts/state_enforcement.sh

3. Verify that the next 2 state-enforcement pods within kube-system namespace complete successfully by running
kubectl get pods -n kube-system

4. ทำการ access เข้าไปที่ vRealize Automation portal

VMSA-2022-0011 | Fixed version in VMware Identity Manager (vIDM) by KB88099

By Lerpong Intaraworrapath | May 3rd, 2022

VMware ได้ประกาศ Security Advisory ช่องโหว่ในระดับ Critical (CVSSv3 Rang 5.3-9.8.) จาก VMSA-2022-0011 ใน Product ดังนี้

  • VMware Workspace ONE Access (Access)
  • VMware Identity Manager (vIDM)
  • VMware vRealize Automation (vRA)
  • VMware Cloud Foundation

ในบทความนี้ เราจะทำ patch VMware Identity Manager (vIDM) ซึ่งจะเป็นการ Fixed multiple vulnerabilities ในการแก้ปัญหา instructions to address CVE-2022-22954, CVE-2022-22955, CVE-2022-22956, CVE-2022-22957, CVE-2022-22958, CVE-2022-22959, CVE-2022-22960, CVE-2022-22961)โดยจะ followup วิธีการ จาก KB88099

Note: ในบทความนี้จะกล่าวถึงเฉพาะ VMware Identity Manager (vIDM) ใน version 3.3.5

โดย VMware Identity Manager (vIDM) จะอยู่ในระดับ Critical โดย มี score สูงถึง 9.8.

How do you fix VMware Identity Manager (vIDM)?

จะเป็นขั้นตอนในการ fixed version VMware Identity Manager (vIDM) โดยเราจะทำการ patch vIDM version 3.3.5 จาก KB88099

1. ทำการ download patch version ของ vIDM 3.3.5 (version อื่นๆ ก็สามารถ download ได้จาก link ตามตาราง ด้านล่าง)

Product Component Version (s)
VMware Identity Manager Appliance3.3.6 
VMware Identity Manager Appliance3.3.5 
VMware Identity Manager Appliance3.3.4 
VMware Identity Manager Appliance3.3.3 

2. เมื่อทำการ click download patch version แล้ว link จะ re-direct ไปยัง download page ให้เรา เลื่อนลงมาด้านล่าง เพื่อจะทำการ download patch

HW-154129-Appliance-3.3.5.zip

3. ทำการ click -> DOWNLOAD NOW

4. ก่อนที่เราจะทำการ patch หรือ upgrade vIDM แนะนำให้ทำการ take snapshot ก่อนทุกครั้ง (uncheck “include virtual machine’s memory”) click -> CREATE

5. ให้ทำการ login vIDM admin portal ทำการ check status vIDM System Diagnostics page จะต้อง GREEN ทุก component

https://vIDM_FQDN/admin

Dashboard -> System Diagnostics Dashboard
ทำการตรวจสอบ แล้วว่า ทุก components เป็น GREEN ทั้งหมด

6. ให้เราทำ transfer file “HW-154129-Appliance-3.3.5.zip” ไปยัง folder tmp ที่เราทำการสร้างไว้ ใน vIDM appliance

Note: Account ที่ใช้สำหรับ login vIDM appliance จะมีอยู่ 2 accounts
sshuser และ root

7. ทำการ login vIDM ด้วย “sshuser” account

8. ถ้ามีการ download 21.08.0.0 hotfix ก่อน 1630 PDT, 7th April 2022, and deployed it, อาจจะเกิดปัญหากับ Database connection monitoring/status. Please download the updated hotfix for this version (HW-154129-Appliance-21.08.0.0-updated-Apr-07-2022.zip ) which addresses this problem
ถ้าทำการ deployed the problematic hotfix and need to replace it with the latest update, please run the following command to before deploying the latest hotfix:

rm -rf /usr/local/horizon/conf/flags/HW-154129-21.08.0.0-hotfix.applied

Patch Deployment Procedure

1. Login as sshuser, sudo to root level access

$sudo su root

2. ทำการตรวจสอบ ไฟล์ใน ข้อ 8.

3. ทำการ change path directory ไปที่ /tmp แล้วตรวจสอบว่ามีไฟล์ ที่เราทำการ transfer อยู่ไหม

4. Unzip the file using the command below:
unzip HW-154129-Appliance-<Version>.zip

unzip HW-154129-Appliance-3.3.5.zip

5. Navigate to the files within the unzipped folder using the command below:
cd HW-154129-Appliance-<Version> 

cd HW-154129-Appliance-3.3.5

6. Run the patch script using the command below:

./HW-154129-applyPatch.sh

*โดยในขั้นตอนนี้ระบบจะถามเราว่ามีการทำ snapshot แล้วใช่ไหม ถ้ามีให้พิมพ์ y

NOTEถ้า vIDM ในระบบของเราเป็นแบบ cluster deployment, ให้ทำการ repeat the steps ด้านบนทุก nodes ใน cluster

Patch Deployment Validation

1. หลังจากเราทำการ patch เสร็จเรียบร้อยแล้ว ให้ทำการ validate vIDM ว่ามีการ patch เสร็จสมบรูณ์หรือไม่

2. Login as an Administrator to the vIDM Console และ ตรวจสอบ System Diagnostics page is GREEN.

3. สำหรับ version 3.3.x , verify the presence of the HW-154129 flag in the /usr/local/horizon/conf/flags/ location.

Validate flags in
/usr/local/horizon/conf/flags/ -
HW-154129-3.3.5.0i-hotfix.applied

HW-154129-3.3.5.0i-hotfix.applied

Conclusion

VMSA-2022-0011 จะเป็นช่องโหว่ Security ที่เป็น Critical ร้ายแรง (9.8.) สำหรับ

  • VMware Workspace ONE Access (Access)
  • VMware Identity Manager (vIDM)
  • VMware vRealize Automation (vRA)
  • VMware Cloud Foundation
  • vRealize Suite Lifecycle Manager

แนะนำให้ผู้ใช้งาน Products ด้านบน ทำการ patch โดยเร็วที่สุด เผื่อป้องกันผลกระทบจากผู้ไม่หวังดี จะเข้ามาทำให้ระบบการทำงาน มีปัญหา หรือใช้งานไม่ได้ ในที่สุด.

vRealize Operations Manager – Compliance

By Lerpong Intaraworrapath | April 25, 2022

ตอนนี้ในหลายๆ องค์กร หรือในหลายๆ บริษัท มีความต้องการ ในการทำ เกี่ยวกับ เรื่อง Policies, Laws, และ Regulations ต่างๆ ภายในบริษัท ให้สอดคล้องกับ ความปลอดภัยในการใช้งาน ภายในเพิ่มมากขึ้น

vRealize Operations Manager มี features ที่สามารถช่วยเราในการทำ Security โดยเรา แค่ enable feature Compliance ขึ้นมา จะช่วยเพิ่มการ ตรวจสอบการใช้งาน vSphere environment ของเราให้มีความปลอดภัย มากขึ้น

Note: vRealize Operations Manager ในบทความนี้จะเป็น version 8.6.2
Note: vRealize Operations Manager : vROPs

vROPs Compliance

1. ทำการ login vRealize Operations Manager -> โดยด้านซ้ายมือ เราจะ เห็น Menu -> Optimize
2. ทำการ expand เมนู Optimize เราก็จะเจอ Compliance ทำการ click -> Compliance

3. เมื่อเราทำการ click -> Compliance แล้ว เราจะเห็นว่า ภายในของ vROPs Compliance จะแบ่งเป็น 3 ส่วน
3.1 VMware SDDC Benchmarks
3.2 Custom Benchmarks
3.3 Regulatory Benchmarks

VMware SDDC Benchmarks
จะเป็น Security Configuration Guideline สำหรับ customer ในการ deploy และ operates SDDC VMware product

Custom Benchmarks
เราสามารถ customize SDDC หรือ Regulations โดยจะแจ้ง alert based on environment เพื่อให้ แน่ใจว่า environment comply with compliance (สามารถ add customer ได้สูงสุด 5 custom benchmarks).

Regulations Benchmarks
จะแสดง Standard regulations compliance ที่ enforce สำหรับธุรกิจที่ใช้งาน vSphere objects. โดยเราสามารถ install compliance packs ได้ตามด้านล่าง

How to enable vRealize Operations Manager Compliance?

1. เมื่อเราทำการ login ที่vROPs แล้วให้เลือก มาที่ menu -> Optimize -> Compliance แล้ว อันดับแรก เราจะทำการ enable “VMware SDDC Benchmarks.
2. ให้เราทำการ click -> ENABLE
2.1 vSphere Security Configuration Guide
2.2 vSAN Security Configuration Guide
2.3 NSX-T Security Configuration Guide
Note: ถ้ามีมากกว่าที่กล่าวถึง ก็ให้ enable ทั้งหมด

3. เมื่อเราทำการ click -> enable ให้เราทำการ click check box -> Enable Policies หลังจากนั้นให้ click -> ENABLE

4. หลังจาก เราทำการ enable “vSphere Security Configuration Guide” แล้ว ให้เรารอสักครู่ เราก็จะพบว่า ตอนนี้ ระบบกำลังทำการ Running initial assessment

5. ให้เราทำการ ENABLE “VMware SDDC Benchmarks” ที่เหลือ

6.ในระหว่างที่เรารอ vSphere , vSAN, NSX-T Security Configuration Guide ทำการ running initial assessment เราจะไป Activate “Regulatory Benchmarks

7. โดยเราจะทำการ Activate “CIS Security Standards” (CIS: Center for Internet Security )

8. ให้ทำการ click -> ACTIVATE FROM REPOSITORY

9. vROPs จะ re-direct ไปที่ Repository page ให้เราทำการ click -> ACTIVATE.

10. หรือ เราสามารถเข้ามา activate ได้โดยมาที่ menu Data Sources -> Integrations -> Repository
(เรายังสามารถ ACTIVATE -> Regulatory Benchmarks ทั้งหมด จากหน้านี้ ที่เดียวก็ได้)

11. เมื่อเราทำการ click -> ACTIVATE แล้ว ก็จะถามให้ เราทำการ “Activate Management Pack” ให้ click -> YES

12. vROPs ก็จะทำการ loading management pack และ installing solution CIS Compliance

13. เมื่อเรากลับมาที่หน้า Compliance เราจะเห็นว่า CIS Security Standard จะมีปุ่มให้เรา click -> ENABLE

14. เมื่อเราทำการ click -> enable ให้เราทำการ click check box -> Enable Policies หลังจากนั้นให้ click -> ENABLE

15. หลังจาก เราทำการ enable “CIS Security Standards” แล้ว ให้เรารอสักครู่ เราก็จะพบว่า ตอนนี้ ระบบกำลังทำการ Running initial assessment

16. เมื่อทำการ Running initial assessment เสร็จเรียบร้อยแล้ว vROPs ก็จะแสดงค่า ของ environment มีจำนวน Compliance และ Non-Compliance

จากรูป เราจะพบจำนวน ของ Compliant และ Non-Compiant

Compliance BenchmarksCompliantNon-CompliantPercent compliant
vSphere Security Configuration107555248
vSAN Security Configuration Guide9887992
NSX-T SEcurity Configuration Guide00100
CIS Security Standards107592513

17. เมื่อเราทำการ click เข้าไปในแต่ละ Benchmarks เราจะได้เห็น รายละเอียด ตัวอย่างเช่น CIS Security Standards.

18.เรายังสามรถจะทำ Custom Benchmarks ได้อีกด้วย (จะกล่าวในบทความต่อไป)

Conclusion:

vRealize Operations Manager จะมีอีกหนึ่ง features ที่สำคัญ ที่สามารถช่วยเราในการ ทำ เรื่อง Security และ Compliance ให้องค์กร ของเรามีความปลอดภัย เพิ่มมากขึ้น

Reference:


VMSA-2021-0028 | Workaround in NSX-T Data Center 2.5.0-3.1.3 (87086)

By Lerpong Intaraworrapath | January 31th ,2022

Information regarding CVE-2021-44228 & CVE-2021-45046 in NSX-T Data Center (2.5.0-3.1.3) (87086)

ในบทความนี้ เราจะมาทำ workaround ในการแก้ปัญหา instructions to address CVE-2021-44228 and CVE-2021-45046 in NSX-T Data Center (2.5.0-3.1.3)โดยจะ followup วิธีการ จาก KB87086.

https://kb.vmware.com/s/article/87086

Note: ในส่วนของ Product อื่นของ VMware และ ข้อมูล CVE-2021-44228 and CVE-2021-45046 ให้ อ่านได้จาก VMSA-2021-0028.

Impact / Risks

  • Internal NSX-T processes/JVM’s เป็นการป้องกัน จากการสร้าง connection จากภายนอก ผ่านการ configured iptables ใน NSX-T Unified Appliance.
  • Version ของ Java JDK ใน NSX-T Datacenter version 3.0.2 และสูงกว่า จะป้องกัน remote code execution publicized (ie. LDAP attack vector).

All versions of NSX-T Data Center จะมี log4js. Further exploit of the log message lookup feature may be possible.

Note: NSX-T Edge VM’s และ Bare Metal Edge Nodes จะไม่กระทบจาก issue นี้.

Note: ถ้ามีการ upgraded หรือ deployed ใหม่ก็จำเป็นจะต้อง re-applied workaround อีกครั้ง.

Note: หากมีการ Restored NSX-T managers หรือ NSX-T Cloud Service Managers จาก backup ก็จำเป็นจะต้อง re-applied workaround อีกครั้ง.

Resolution

Workaround ในบทความนี้เป็น Temporary solution เท่านั้น แนะนำ.

NSX-T Data Center 2.5.3.4, 3.0.3.1 and 3.1.3.5 provide resolution for CVE-2021-44228 & CVE-2021-45046.
VMware recommends the following upgrade paths.

  • NSX-T 2.5.x should upgrade to 2.5.3.4
  • NSX-T 3.0.x should upgrade to 3.0.3.1
  • NSX-T 3.1.x should upgrade to 3.1.3.5

NSX-T 2.5.3.4 Release Notes: https://docs.vmware.com/en/VMware-NSX-T-Data-Center/2.5.3/rn/VMware-NSX-T-Data-Center-2534-Release-Notes.html

NSX-T 3.0.3.1 Release Notes:https://docs.vmware.com/en/VMware-NSX-T-Data-Center/3.0/rn/VMware-NSX-T-Data-Center-3031-Release-Notes.html

 NSX-T 3.1.3.5 Release Notes: https://docs.vmware.com/en/VMware-NSX-T-Data-Center/3.1/rn/VMware-NSX-T-Data-Center-3135-Release-Notes.html

Workaround

ในการ apply workaround สำหรับ CVE-2021-44228 & CVE-2021-45046 ให้ทำการ connect ไปที่ NSX-T Data Center Manager หรือ NSX-T Cloud Service Manager.

Imortant: ในทำการ apply workaround สำหรับ NSX-T Manager Cluster ให้ทำทีละ ตัวและให้ NSX-T Manager ตัวที่ทำ มี status “STABLE” ก่อนจะไปทำตัวถัดไป.

โดย version NSX-T Manager ที่เราทำการ apply workaround จะเป็น
NSX-T Manager 3.1.2.0.0.17883600

Account access
AccountAccess
adminNSX-T UI
adminSSH
rootSSH

1.ให้ทำการ Backup NSX-T manager ผ่าน SFTP.

Reference the following document for guidance, if needed: https://docs.vmware.com/en/VMware-NSX-T-Data-Center/3.2/administration/GUID-E6181BF1-2CB7-4870-B508-BFAF5B47D702.html

2.ทำการ download Debian package “unified-appliance-log4j2-patch_3.1.3.6.0.19099859_all.deb” จาก KB87086.

3.ทำการ copy Debian package ไปไว้ NSX-T Manager appliances ทั้ง 3 NSX-T Manager appliances โดยใช้ WinSCP หรือ Linux based SCP หรือ tool ที่สามารถ transfer files ได้.

4.ให้ทำการ check status NSX-T Manager appliances.
โดย Cluster status จะต้อง เป็น “STABLE” และ NSX-T Manager จะต้องเป็น “Available“.

5.Login NSX-T Manager appliance โดย SSH ใช้ user account “admin“.

6.ให้ใช้ command check cluster status เพื่อตรวจสอบ cluster status อีกครั้ง โดย Overall Status จะต้องเป็น “STABLE” และ Status ต้อง “UP” ทั้ง 3 nodes ทุก services.
get cluster status

6.ให้ switch to account “root“.
st en
Enter the root password.

7.Install Debian package ด้วย command ด้านล่าง ใน directory ที่เราเก็บ ไฟล์ไว้
dpkg -i unified-appliance-log4j2-patch_3.1.3.6.0.19099859_all.deb

8.เมื่อกด Enter แล้ว script ก็จะทำการ check ไฟล์ JndiLookup ให้ทำการ รอ จนเสร็จสิ้น script.

9.ทำการ reboot system.
/sbin/reboot

Note: ให้ทำทีละ NSX-T Manager appliances ห้ามทำพร้อมกัน. ให้แน่ใจว่า NSX-T Manager หลังจาก ที่เราทำการ reboot แล้ว status “STABLE” แล้วจึงจะทำตัวถัดไป.

10.ในการ Monitor status NSX-T Manager cluster services เราจะใช้ command หรือ ใช้การ Monitor จาก หน้าจอ NSX-T Manager UI ก็ได้.

Command
get cluster status  

ให้แน่ใจว่าทุก status “UP” ทั้งหมด.

NSX-T UI

เราจะพบว่า ที่หน้า NSX-T Manager appliance status จะเป็น “DEGRADED“.
ให้ Click ที่ “VIEW DETAILS” เพื่อดู services status.

ให้แน่ใจว่าทุก status “UP” ทั้งหมด.

หลังจากนั้นให้ทำการ check status ของ NSX-T Manager appliances ให้ เป็น status “STABLE“.

Verification Steps

1.ให้ทำการ verify workaround ที่ apply ไปถูกต้องหรือไม่ โดยให้ login ด้วย account “root“.

2.ทำการ verify configuration โดย updated ด้วย “formatMsgNoLookup=true” flag โดยใช้ command ด้านล่าง.
grep "wrapper.java.additional.100=" /usr/tanuki/conf/*-wrapper.conf

3.ทำการ verify ไฟล์ “JndiLookup class” จะต้อง removed ออกจาก Jar files บน appliances โดยใช้ command ด้านล่าง.
find /usr /opt -xdev -iname "*.jar" | while read l; do  unzip -l $l|grep "JndiLookup.class"; if [[ ${PIPESTATUS[1]} -eq 0 ]]; then echo $l; fi; done

โดยผลลัพธ์ จะไม่แสดงผลอะไร ออกมา (None) แบบด้านล่าง.

Repeat step

ให้ ทำการ repeat step จากหัวข้อ Workaround เริ่มจากข้อ 4 ไปจนถึง Verification Step ในข้อ 3 จนครบทุกตัว (ให้ทำทีละตัว).

Revert the workaround

CVE-2021-44228 & CVE-2021-45046 to VMware NSX-T Data Center perform the following steps on each NSX-T Manager or NSX-T Cloud Service Manager.

โดยให้ restore จาก NSX-T Manager backup ที่เราทำการ backup ก่อนจะ apply the workaround.

Reference the following document for guidance, if needed: https://docs.vmware.com/en/VMware-NSX-T-Data-Center/3.2/administration/GUID-9749F041-15E5-4662-85E7-756D4B071C17.html

Conclusion

ในบทความนี้จะเป็น workaround instructions to address CVE-2021-44228 and CVE-2021-45046 in NSX-T Data Center (2.5.0-3.1.3)โดยจะ followup วิธีการ จาก KB87086 เท่านั้น โดย fix version สามารถเข้าไป download และ apply ตาม version ที่ท่านใช้งานอยู่ โดย ให้ทุกท่านติดตาม VMSA-2021-0028 ในการทำ workaround หรือ fix version รวมถึง Product อื่นๆ ของ VMware ที่ได้รับผลกระทบ เช่นกัน.

VMSA-2021-0028 | Workaround in vRealize Operations 8.x (87076)

By Lerpong Intaraworrapath | January 17th ,2022

Workaround instructions to address CVE-2021-44228 and CVE-2021-45046 in vRealize Operations 8.x (87076)

ในบทความนี้ เราจะมาทำ workaround ในการแก้ปัญหา instructions to address CVE-2021-44228 and CVE-2021-45046 in VMware vRealize Operations Manager 8.x โดยจะ followup วิธีการ จาก KB87076.

https://kb.vmware.com/s/article/87076

Note: ในส่วนของ Product อื่นของ VMware และ ข้อมูล CVE-2021-44228 and CVE-2021-45046 ให้ อ่านได้จาก VMSA-2021-0028.

Impact / Risks

  • Recommended ให้ take snapshots vRealize Operations ทุก nodes ก่อน apply workaroundโดยสามารถ ทำตามได้จาก link How to take a Snapshot of vRealize Operations.
  • Mitigation จะยังคงเกิดขึ้นอยู่ ถ้ามีการ installed management pack หรือ activated หลังจาก apply patch. แนะนำให้ installed หรือ activated ให้เรียบร้อยก่อน แล้วถึงจะทำการ apply workaround.
  • การ appy workaround แนะนำให้ reapplied หลังจากมีการ deploying หรือ updating new vRealize Operations nodes or Cloud Proxies ที่ไม่มี bug fixed.
  • Mitigation ของ WAR files จะยังคงเกิดขึ้นอยู่ ถ้ามีการ redeployed vRealize Operations.

Resolution

This issue is resolved in the following releases:

Workaround ในบทความนี้เป็น Temporary solution เท่านั้น แนะนำ.

Workaround

Notice: The below content has been updated as of 12/15/2021 to add workaround steps for the related CVE-2021-45046 as noted above.  Please re-run all of the below steps even if you have already implemented the original CVE-2021-44228 workaround steps by running the data-rc-witness-log4j-fix.sh and cp-log4j-fix.sh scripts.

ในบทความนี้เราจะทำการ apply workaround สำหรับ “vRealize Operations Manager version 8.4.0” โดยจะประกอบ ด้วย
-Analytic (Primary, Replica, Data), Remote Collector 2 nodes จำนวนทั้งหมด 5 nodes (จะไม่มี Cloud Proxies).

โดยเราจะ ใช้ 2 scripts ด้วยกัน data-rc-witness-log4j-fix.sh and vrops-log4j-fix.sh โดย download ได้จาก KB87076

1.ทำการ Log in to the vRealize Operations Manager Admin UI โดยใช้ local admin user (https://vROPs-Name or vROPs-IP/admin).

2.ทำการ Click “TAKE CLUSTER OFFLINE” under Cluster Status.

Note: Wait for Cluster Status to show as Offline.
ถ้าเราพบว่าหน้า vROPs admin จะไม่สามารถ access ได้ ให้เรา access โดยตรงไป ที่ vROPs Master node IP address (https://vROPs-Master node name or IP address/admin).

3.ทำการ take snapshots vRealize Operations nodes ทั้ง 5 nodes [Analytic (Primary, Replica, Data), Remote Collector 2 nodes] ก่อนจะ apply workaround (How to take a Snapshot of vRealize Operations.).

4.ทำการ copy file data-rc-witness-log4j-fix.sh และ vrops-log4j-fix.sh ไปที่ path /tmp ของ vROPs ทั้ง 5 nodes [Analytic (Primary, Replica, Data), Remote Collector 2 nodes] โดยอาจจะใช้ SCP หรือ Tools ที่สามารถ copy file ได้.

5.เราจะ เริ่มทำที่ Master nodes เป็นตัวแรกก่อน.

6.ให้เรา SSH หรือ Console โดยใช้ root login account ในการ access.

7.ทำการ cd ไปที่ patch /tmp แล้วทำการตรวจสอบ ดูว่าทั้ง 2 files ปรากฏ อยู่ใน path ครบไหม.

8.ทำการ run command เพื่อสามารถจะ execute scripts data-rc-witness-log4j-fix.shได้.
chmod +x data-rc-witness-log4j-fix.sh

9.ทำการ run command เพื่อสามารถจะ execute scripts vrops-log4j-fix.shได้.
chmod +x vrops-log4j-fix.sh

10.ทำการ run command execute scripts “data-rc-witness-log4j-fix.sh“.
./data-rc-witness-log4j-fix.sh

Note: ให้ตรวจสอบให้แน่ใจหลังจาก run command จะต้องไม่มี ERROR (NO ERROR).

11.ทำการ run command execute scripts “./vrops-log4j-fix.sh“.
./vrops-log4j-fix.sh

Note: ให้ตรวจสอบให้แน่ใจหลังจาก run command จะต้องไม่มี ERROR (NO ERROR).

12.ทำการ restart the “CaSA service”:
service vmware-casa restart

Verify the change

ทำการ verify the workaround for CVE-2021-44228 ที่เราทำการ applied to vRealize Operations ว่าถูกต้องไหม ตาม step ด้านล่าง.

1.ทำการ run command สำหรับ verify ถ้า the data-rc-witness-log4j-fix.sh script สำเร็จ:
ps axf | grep --color log4j2.formatMsgNoLookups | grep -v grep

Note: โดยหลังจาก run command จะต้องมี output ออกมา; ถ้าไม่มี output ออกมาแสดงว่า applied workaround ไม่สำเร็จ.

2.ทำการ run command สำหรับ verify ถ้า the vrops-log4j-fix.sh script สำเร็จ:
./tmp/vrops-log4j-fix.sh

Note: ผลลัพธ์ ที่ได้จาก run command
Searching for impacted .jar files. Please wait…
No impacted .jar files found

Next step

ให้ทำการ Repeat Workaround step ตั้งแต่ข้อ 6 จนถึง Verify the change สำหรับ node ที่เหลือ อีก 4 nodes [Analytic (Replica, Data), Remote Collector 2 nodes].

Remark

โดยถ้า ท่านมี Cloud Proxies ก็ให้ทำ Cloud Proxies เพิ่มเติมจากใน KB87076 โดยใช้ script “cp-log4j-fix.sh” เพิ่มเติม.

Last step

หลังจากเราทำการ apply script ครบทุก node (ให้ตรวจสอบ ให้แน่ใจ ว่าเราทำครบทุก node).

1.ทำการ Log in to the vRealize Operations Manager Admin UI โดยใช้ local admin user (https://vROPs-Master node or vROPs-IP Master node/admin).

2.เราจะพบว่า cluster จะยังเป็น status offline.

3.ให้เราทำการ click “BRING CLUSTER ONLINE“.

4.ให้รอจน cluster status “ONLINE“.

5.แล้วหลังจากนั้นให้ login vROPs UI console.
https://vrops name or ip address/ui

Conclusion

ในบทความนี้จะเป็น workaround สำหรับ VMware vRealize Operations Manager 8.x เท่านั้น โดย fix version สามารถเข้าไป download และ apply ตาม version ที่ท่านใช้งานอยู่ โดย ให้ทุกท่านติดตาม VMSA-2021-0028 ในการทำ workaround หรือ fix version รวมถึง Product อื่นๆ ของ VMware ที่ได้รับผลกระทบ เช่นกัน.

VMSA-2021-0028 | Workaround in vCenter Server virtual appliance (87081, 87088)

By Lerpong Intaraworrapath | January 6th, 2022

Workaround instructions to address CVE-2021-44228 and CVE-2021-45046 in vCenter Server and vCenter Cloud Gateway (87081)

ในบทความนี้ เราจะมาทำ workaround ในการแก้ปัญหา instructions to address CVE-2021-44228 and CVE-2021-45046 in vCenter Server virtual appliance 7.x, 6.7.x, 6.5.x โดยจะ followup วิธีการ จาก KB87081 และ KB87088

https://kb.vmware.com/s/article/87081?lang=en_US
https://kb.vmware.com/s/article/87088

Note: ในส่วนของ Product อื่นของ VMware และ ข้อมูล CVE-2021-44228 and CVE-2021-45046 ให้ อ่านได้จาก VMSA-2021-0028

Impact / Risks

  • ให้ทำการ remove VCHA ก่อนทำการ run script.
  • environment ที่มี external PSCs จะต้องทำการ run script ทั้ง vCenter และ PSC appliances.
  • Restore จาก File-Based Backup จะทำให้ environment กลับสู่ vulnerable. ให้ใช้ vc_log4j_mitigator.py หลังจาก restore.
  • อัปเกรด vCenter Appliance จะทำให้ environment กลายเป็น vulnerable. ให้ใช้ vc_log4j_mitigator.py หลังจาก อัปเกรด vCenter Appliance.

Resolution

Workaround ในบทความนี้เป็น Temporary solution เท่านั้น.

Completed remediation scenarios:

จะมี 3 วิธีในการทำ workaround สำหรับ vCenter server virtual appliance. ให้เลือกทำ วิธีใดวิธีหนึ่งเท่านั้น

  1. Used vc_log4j_mitigator.py from KB87081.
  2. Used vmsa-2021-0028-kb87081.py script from KB 87088 and remove_log4j_class.py from this KB87081.
  3. Used the manual workaround steps in KB87081 and remove_log4j_class.py.

Note: ในบทความนี้ จะใช้ วิธีที่ 2Used vmsa-2021-0028-kb87081.py script from KB 87088 and remove_log4j_class.py from this KB87081.
โดยจะเป็น vCenter server virtual appliance version 7.0.1.00301

Workaround

Automated Workaround (Recommended)

  1. ทำการ take snapshot “vCenter server virtual appliance”.
  2. ทำการ check disk space available by command “df-h” (capture screen ไว้ด้วย).
  3. ทำการ check vCenter server service by command “service-control –status –all” (capture screen ไว้ด้วย).
  4. Download the script attached this KB 87088 (vmsa-2021-0028-kb87081.py )

5. Login to the vCSA using an SSH Client (using Putty.exe or any similar SSH Client)

6. Login to the vCSA using an SSH Client (using Putty.exe or any similar SSH Client)

7. Transfer the file to /tmp folder on vCenter Server Appliance using WinSCP
Note: It’s necessary to enable the bash shell before WinSCP will work

8. Provide the root user name and password when prompted.

9. Run this command to enable the Bash shell:
shell.set --enable True

10. Run this command to access the Bash shell:
shell

11. In the Bash shell, run this command to change the default shell to Bash:
chsh -s /bin/bash root

12. ทำการ copy ไฟล์ vmsa-2021-0028-kb87081.py และ remove_log4j_class.py โดยใช้ WinSCP ไปเก็บไว้ที่ /tmp

13. ทำการ Login to the vCSA using an SSH Client (using Putty.exe or any similar SSH Client) แล้วเข้าไปที่ path /tmp ใช้ “ls” command ทำการตรวจสอบไฟล์ ที่เราทำการ upload เข้าไป

14. ทำการ run script vmsa-2021-0028-kb87081.py
root@xxxx[/tmp]#python vmsa-2021-0028-kb87081.py

15. พิมพ์ Y แล้วกด Enter

16. Script ก็จะทำการ run process เพื่อจะทำ workaround เกี่ยวกับ CVE-2021-44228 and CVE-2021-45046 (ใช้เวลา10 นาที โดยประมาณ).
โดย script ก็จะแสดง status ของแต่ละ process และที่สำคัญจะต้องแสดงผล “SUCCESS”
-vMON Config files
-VMware Update Manager Config files
-Analytics service Config files
-DBCC Utility Config files

17. เมื่อทำการ run script แรก เสร็จเรียบร้อยแล้วให้ เรา run script ตัวที่ 2 คือ remove_log4j_class.py from this KB87081.
root@xxxx[/tmp]#python remove_log4j_class.py

18. พิมพ์ Y แล้วกด Enter

19. Script ก็จะทำการ run process เพื่อจะทำ workaround เกี่ยวกับ CVE-2021-44228 and CVE-2021-45046 (ใช้เวลา10 นาที โดยประมาณ).โดย script ก็จะแสดง status ของแต่ละ process

Verify the changes

เมื่อเราทำการ run script ทั้ง 2 scripts completed แล้วให้เราทำ การ ตรวจสอบให้แน่ใจว่า script ที่เรา run นั้นถูกต้อง

  1. Verify if the stsd, idmd, and vMon controlled services were started with the new -Dlog4j2.formatMsgNoLookups=true parameter:
    ps auxww | grep formatMsgNoLookups

โดย จะแสดง ผล -Dlog4j2.formatMsgNoLookups=true

2. Verify the Update Manager changes are shown under “System Properties” in the output of the following two commands:
cd /usr/lib/vmware-updatemgr/bin/jetty/
java -jar start.jar --list-config
system properties:
log4j2.formatMsgNoLookups = true (/usr/lib/vmware-updatemgr/bin/jetty/start.ini)

3. Verify the Analytics Service changes:
grep -i jndilookup /usr/lib/vmware/common-jars/log4j-core-2.8.2.jar | wc -l
โดย จะแสดงค่า “0

4. Verify the script successfully removed JndiLookup.class from all java files with the following command:
python remove_log4j_class.py -r

จะได้ผลลัพธ์ ดังนี้
2021-12-18T00:04:38 INFO main: Running in dryrun mode
2021-12-18T00:05:04 INFO main:
===== Summary =====
List of vulnerable files:
2021-12-18T00:05:04 INFO main: Done.

Remark

หลังจาก เราทำการ run script เสร็จเมื่อกลับที่ vSphere client browser ของ vCenter server จะพบว่า ที่ Tab -> Monitor ในหน้า Skyline Health จะ show warning “Online health checks execution” (ถ้าไม่เจอแบบนี้ก็ไม่เป็นไร นะครับ)
!!!warning ที่แสดง จะหายไป เอง นะครับ!!!

Conclusion

ในบทความนี้จะเป็น workaround สำหรับ vCenter server virtual appliance 7.x เท่านั้น โดย fix version ยังไม่มีออกมาในส่วน version อื่น ให้ทุกท่านติดตาม VMSA-2021-0028 ในการทำ workaround หรือ fix version รวมถึง Product อื่นๆ ของ VMware ที่ได้รับผลกระทบ เช่นกัน.

SHD – Skyline Health Diagnostics

By Lerpong Intaraworrapath | November 17th ,2021

SHD – Skyline Health Diagnostics

เมื่อมีเหตุการณ์ ที่ vSphere ESXi host down การทำงาน ของ vSAN หรือ VCF มีปัญหา และเราต้องการ investigate logs system จาก vSphere ESXi host หรือ ต้องการทราบ ว่า vSphere ESXi host มี error หรือ issues อะไร บ้าง เราจะทำได้อย่างไร

Skyline Health Diagnostics จะช่วยเราในการวิเคราะห์ และแสดงผล จาก bundle logs ที่เรา อัปโหลด เข้าไปใน SHD

โดย report จะรายงานค่า error และ issues ที่เกิดขึ้นกับ vSphere ESXi host ในระบบของเรา รวมถึง vSAN VCG (VMware Compatibility Guide) ที่ช่วยเราตรวจสอบ compatibility guide, Network driver, Firmware ต่างๆ

SHD (Skyline Health Diagnostics) Overview

Existing issue resolution workflow

อันนี้จะเป็น workflow โดยทั่วไป เวลาเกิดปัญหา

  1. เมื่อพบปัญหา การทำงานของระบบ
  2. ส่วนใหญ่ ก็จะทำการค้นหาจาก Google
  3. เมื่อค้นจาก Google เราก็จะพบบทความที่หลากหลาย ที่เกี่ยวข้องกัน
  4. ใช้เวลา ในการค้นหาจนกว่าจะเจอบทความที่ใช่
  5. ถ้าปัญหา ยังไม่ถูกแก้ไข ก็จะ ติดต่อ GS (Global Support) ทำการเปิด เคส
  6. ทำงานร่วมกับ GS เพื่อแก้ปัญหา

เราจะ เห็นว่าจะ สามารถ แบ่งเป็น 3 step หลักๆ คือ

  • พบปัญหา
  • เวลาในการแก้ปัญหา
  • วิธีการแก้ปัญหา

SHD (Skyline Health Diagnostics) จะช่วยลดเวลาในการ troubleshoot ปัญหา และลดเวลาที่เราใช้ในแก้ปัญหา

VMware SHD for vSphere

Issue resolution workflow with SHD

อันนี้จะเป็น SHD workflow เวลาเกิดปัญหา จะเป็นอย่างไร

  1. เมื่อพบปัญหา การทำงานของระบบ
  2. ทำการ Run SHD จาก log bundle ที่เกี่ยวข้อง
  3. จะได้ KB ที่เกี่ยวข้องกับปัญหา ที่เกิดขึ้น และ action plan
  4. ถ้าไม่พบคำแนะนำ จากปัญหาที่เกิดขึ้นให้ติดต่อ GS (Global Support) ทำการเปิด เคส
  5. จะเร็วขึ้นในการแก้ปัญหา จาก SHD log output

ขั้นตอนการ Deploy SHD (Skyline Health Diagnostics)

  1. ทำการ download SHD (Skyline Health Diagnostics) OVA file จาก link ด้านล่าง

https://customerconnect.vmware.com/downloads/get-download?downloadGroup=SKYLINE_HD_VSPHERE

2. ทำการ เลือก OVA ไฟล์ ขนาดไฟล์ 954.96 MB (version 2.5.2), click “DOWNLOAD NOW“.

3. เมื่อทำการ download เสร็จเรียบร้อยแล้ว เราก็จะได้ไฟล์ OVA มา 1 ไฟล์

4. ทำการ connect vCenter Server เพื่อจะทำการ deploy SHD OVA ไฟล์.

5. ทำการเลือก location ที่เรา save OVA ไฟล์.

6. ทำการเลือก location และใส่ชื่อ virtual machine name (ในที่นี้ใช้ชื่อ VM-Shd), click “NEXT“.

7. ทำการเลือก Compute resource, click “NEXT“.

8. Review details, click “NEXT“.

9. Accept License agreement, click “NEXT

10. ทำการเลือก Storage, click “NEXT“.

11. ทำการเลือก Network, click “NEXT“.

12.ใส่ Password สำหรับ root account และ shd-admin account

13.ใส่ค่าต่างๆ ให้ครบ หลังจากนั้นให้ click “NEXT“.

14. Read to complete, click “FINISH“.

15.เมื่อเราทำ deploy เสร็จเรียบร้อยแล้วให้ เรา Power-on SHD VM (VM-Shd)

16.ทำรอสักพัก หลังจากนั้นให้ทำการ “Launch Web Console” เราจะ พบว่า VM-Shd จะทำการ start process เพื่อทำการ boot SHD

17. ต่อมาให้ เรา access SHD โดย เปิด browser ให้ใส่ IP address ของ SHD, login ด้วย user “shd-admin“.

18. Click NEXT for “End user license agreement” และ “Customer Experience Improvement“, click “FINISH“.

19. เราก็จะเข้ามาเจอหน้าแรกของ SHD (Skyline Diagnostics).

จากด้านซ้ายมือ เราจะเห็น menu ในการ connect system เพื่อจะทำการ download และ analyze log bundle

  1. Connect ผ่าน vSphere (vCenter Server)
  2. Connect ผ่าน vSAN-HealthCheck (vCenter Server)
  3. Connect ผ่าน VMware Cloud Foundation (SDDC)

หรือเรา สามารถ upload bundle logs มาทำการ analyze ผ่านทาง SHD (Skyline Diagnostics)

20. เราจะทำการ Analyze log bundle จาก vSphere. โดยเลือก vSphere จากด้าน เมนู ด้านซ้ายมือ หลังจากนั้นให้ เรา ใส่ รายละเอียด

  • vCenter server (FQDN or IP)
  • Username access vCenter Server
  • Password access vCenter Server

Click, “CHECK CONNECTION“.

21. ทำการ Click “RUN DIAGNOSTICS“.

22. ทำการเลือก vSphere ESXi host ที่เราต้องการจะ Analyze logs (เราสามารถเลือกได้มากกว่า 1 host), click “VALIDATE“.

23. ใส่ชื่อ Report, click “FINISH“.

24. SHD ก็จะทำ การ download Log Bundle แล้วก็ Process ตาม workflow จนกระทั่ง Finalize Workflow จนได้เป็น Report ออกมา

24. โดย Report เราสามารถ Click ดูจาก ปุ่ม “SHOW REPORT” หรือ เราจะเลือกไปที่ Show Reports tab แล้วเลือก download หรือ ให้แสดง Report ก็ได้

25. ตัวอย่าง SHD report

Conclusion

SHD (Skyline Health Diagnostics) จะเป็น Tool อีกหนึ่งตัวที่จะช่วยให้เราทำวิเคราะห์ Logs ได้ด้วยตัวเอง พร้อมทั้งมี Report ที่แสดง Log Analysis รวมถึง มี การ ตรวจสอบ vSAN VCG (VMware Compatibility Guide) ที่ช่วยเราตรวจสอบ compatibility guide, Network driver, Firmware ต่างๆใน vSphere environment ที่เราใช้งานให้ด้วย

Reference

Credit: ขอขอบคุณน้อง Nat (Napongtorn) สำหรับขั้นตอนการ run SHD

VMCO – Virtual Machine Compute Optimizer

By Lerpong Intaraworrapath | November 1st ,2021

Virtual Machine Compute Optimizer

เราจะรู้ได้อย่างไรว่า vCPU ที่เรา assign ให้กับ Virtual machine นั้น ตัว Virtual machine จะสามารถใช้งาน CPU ได้เต็มประสิทธิภาพ และได้ประสิทธิภาพที่ดีที่สุด Optimized Performance.

ยกตัวอย่าง ในการ assign vCPU ให้กับ Virtual machine เราต้องการ 4vCPUs เราสามารถ assign ได้หลายรูปแบบ เช่น

VMSocketsVMCoresPerSocketvCPUs
144
414
224

จะเห็นว่าทั้ง 3 แบบเราจะได้ 4 vCPUs เหมือนกัน !!!แต่ แบบไหนจะให้ ประสิทธิภาพ และใช้งาน vCPU จาก Physical CPU ได้เต็มประสิทธิภาพมากที่สุด

จะมี Tool หนึ่งตัวมาแนะนำ ใช้สำหรับตรวจสอบดูว่า vCPU ที่เรา assign ให้กับ Virtual machine ใน environment ของเรามีการ assign vCPU ได้ถูกต้อง และใช้งาน ได้เต็มประสิทธิภาพไหม.

VMCO – Virtual Machine Compute Optimizer

The Virtual Machine Computer Optimizer (VMCO) เป็น Powershell script และ PowerCLI module ซึ่งจะ capture ดาต้าเกี่ยวกับ vSphere ESXi host และ VMs ที่ใช้งานใน environment ซึ่งจะทำการ ส่ง report รายงานการ configured virtual machine based on การใช้งาน Host CPU และ Memory.

โดยค่าที่แสดงผลจะมี “TRUE” กับ “FALSE

  • TRUE จะ Optimized
  • FALSE จะไม่ Optimized

How to install

  1. เริ่มขั้นตอนแรกให้ ไปทำ การ download file VMCO จาก link ด้านล่าง

https://flings.vmware.com/virtual-machine-compute-optimizer

จากนั้นเราก็จะได้ไฟล์ “VirtualMachineComputeOptimizer-master-3.0.0.0.zip

2. ให้เราทำการ unzip ไฟล์ออกมา ภายใน Folder จะทั้งหมด 4 ไฟล์

3. วิธีการ ใช้งาน และ การดู report จะอยู่ในไฟล์ “Documentation – Virtual Machine Compute Optimizer.pdf” (แนะนำให้อ่าน เพื่อทำความเข้าใจเพิ่มเติม)

4. ให้เราทำการ Right-click ไฟล์ “Virtual_Machine_Compute_Optimizer_v3.0.0.ps1” แล้วทำการ เลือก “Run with PowerShell“.

5. หน้าต่าง PowerShell ก็จะปรากฏขึ้นมา โดยก็จะมีคำถาม trust script policy ของ script ที่เรา run ก็ให้เราตอบ Y หรือ A แล้วกด “Enter

6. ต่อมาก็จะเป็นแสดง path ที่เราจะทำการเก็บไฟล์ CSV location จะให้เก็บไว้ที่ไหน ถ้าไม่เป็นแปลง ก็จะเป็น path default ที่เรา run ไฟล์ PowerShell ถ้าเราไม่ต้องการเปลี่ยน ก็ให้กด “Enter

7. ตัว VMCO ก็อาจจะ require ให้เรา install module เพิ่ม

8. เมื่อทำการ Install module จนเสร็จเรียบร้อย ตัว VMCO จะให้เราใส่ vCenter server name (เราสามารถ ใส่ได้มากกว่า 1 vCenter server โดยใช้ comma หลัง vCenter server แต่ละตัว).

9. ในตัวอย่างนี้ผมจะใส่ 2 vCenter servers แล้วให้ “Enter

10. จะมีหน้าต่างให้เราใส่ credential ของ vCenter server แล้ว click “OK“.

11. VMCO ก็จะทำการ Retrieving data ของ virtual machine และ vSphere ESXi host

12. เมื่อทำการ เก็บข้อมูลเสร็จเรียบร้อย ก็จะมีข้อความ Analysis complete ตัว report ก็จะไปเก็บไว้ใน path ที่เราเลือกในข้อ 6. ให้ “Enter“.

13. ให้เราทำการ browse ไปยัง Folder ที่เก็บไฟล์ เราจะเจอไฟล์ “VMCO_Reports.csv”

14. เมื่อเราเปิดไฟล์ขึ้นมาก็จะมีรายละเอียดของ vCenter server ต่างเช่น vCenter server name, Cluster name, Hostname, etc.

15. แต่สิ่งที่เราสนใจจะเป็น Column “V” คือ “VMOptimized

16. โดยค่าใน “VMOptimized” จะมีคือ TRUE และ FALSE

  • TRUE จะค่าที่บอกว่า Virtual machine ที่เราใช้งานอยู่มีการ configured vCPU ที่ Optimized แล้ว
  • FALSE จะค่าที่บอกว่า Virtual machine ที่เราใช้งานอยู่มีการ configured vCPU ที่ยังไม่ Optimized แนะนำให้ทำการ re-configure

ยกตัวอย่าง จากรูปด้านล่าง

จากบรรทัดที่สอง ค่า vCPU ที่เราต้องการสำหรับ virtual machine คือ 2 vCPU และค่า “VMOptimized” คือ FALSE

  • Column U จะเป็นค่า vCPU ที่เราต้องการ
  • Column S, T คือค่า vCPU ที่เรา configured ไว้่
  • Column V คือค่า VMOptimized (TRUE, FALSE) ในที่นี้แสดงค่า FALSE
  • Column W, X คือค่า vCPU ที่เราจะต้อง re-configure ใหม่ให้ค่า Optimized
  • Column Y จะเป็นค่า Priority (LOW, MEDIUM, HIGH) สำหรับดูลำดับความสำคุญในการจะ re-configure virtual machine
  • Colum Z จะบอก detail ว่าทำไม vCPU ถึงไม่ Optimized Performance สาเหตุเพราะอะไร

Conclusion

VMCO จะเป็น Tool อีกหนึ่งตัวที่จะช่วยให้เราทำทราบว่า มี virtual machine ตัวไหน ใน vSphere environment ที่เราใช้งาน ที่ Optimized performance บ้าง ตัวไหนที่เราต้องทำการ ปรับ แก้ไข ให้ มี Performance ที่ดีขึ้นเพื่อให้ vCPU จากการใช้งาน Physical CPU จาก Physical server ได้เต็มประสิทธิภาพ ได้ดีที่สุด.

Reference:

Credit: ขอขอบคุณน้อง Nat (Napongtorn) สำหรับขั้นตอนการ run VMCO