By Lerpong Intaraworrapath | October 19th ,2021
Disk group performance dashboard
เราจะมีวิธีการอย่างไร ในการ monitor performance ของ vSAN disk groups. โดยเราสามารถ เลือกในแต่ละ Cluster แล้วทำการ monitor performance vSAN disk group รวมถึง health capacity.
Note: vRealize Operations Manager ที่นำมาใช้งานในบทความนี้เป็น version 8.4.0 (17863947) Advanced Edition
โดย Widgets ที่เราจะนำมาใช้ ในการสร้าง vROPs dashboard จะใช้ด้วยกันอยู่ 4 widget:
- Object list
- Heat map
- Scoreboard
- Object relationship
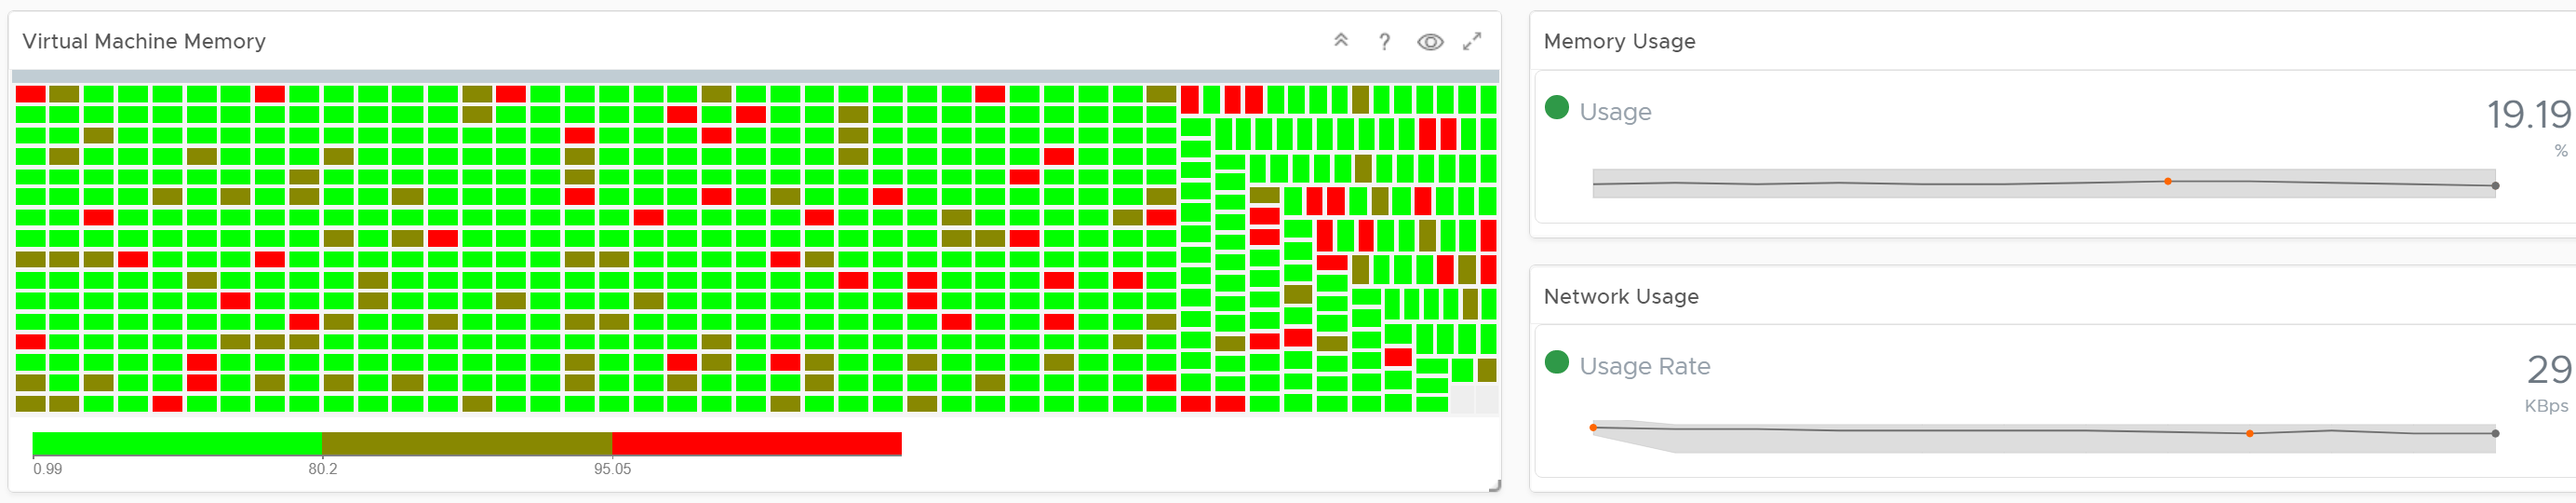
โดยเมื่อเราทำการเลือก Cluster จาก Object list จำนวน vSAN disk group ทั้งหมดจากใน Cluster ที่เราเลือกจะไปแสดงผลที่ Heat map. ที่ Heat map จะแสดงผลเป็น Blocks size ตามชนาดความจุของ แต่ละ disk group และ Color ก็จะแสดงผลจากค่า Average write latency in milliseconds.
เมื่อเราทำการ เลือก Disk group จาก Heat map แล้ว ค่า Performance metrics ทั้งหมด ก็จะแสดงผลใน Scroeboard รวมถึง Capacity Disk Health ก็จะแสดงผลค่า Object relationship ด้วย.
ขั้นตอนการสร้าง vSAN disk group dashboard
ทำการสร้าง Dashboard (Version ของ vROPs ที่สามารถสร้าง dashboard ได้จะต้องเป็น Advanced หรือ Enterprise edtion )
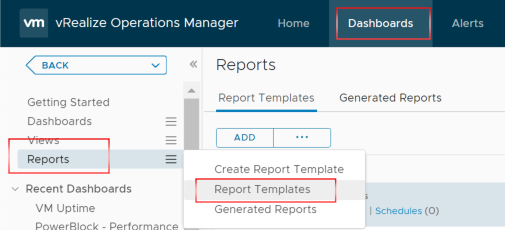
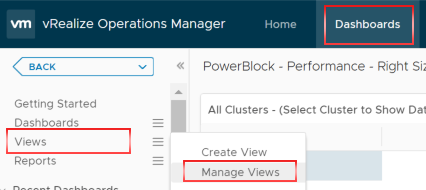
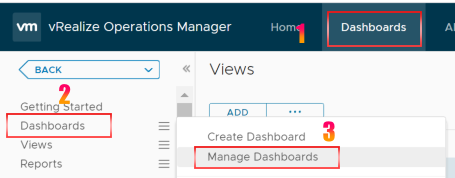
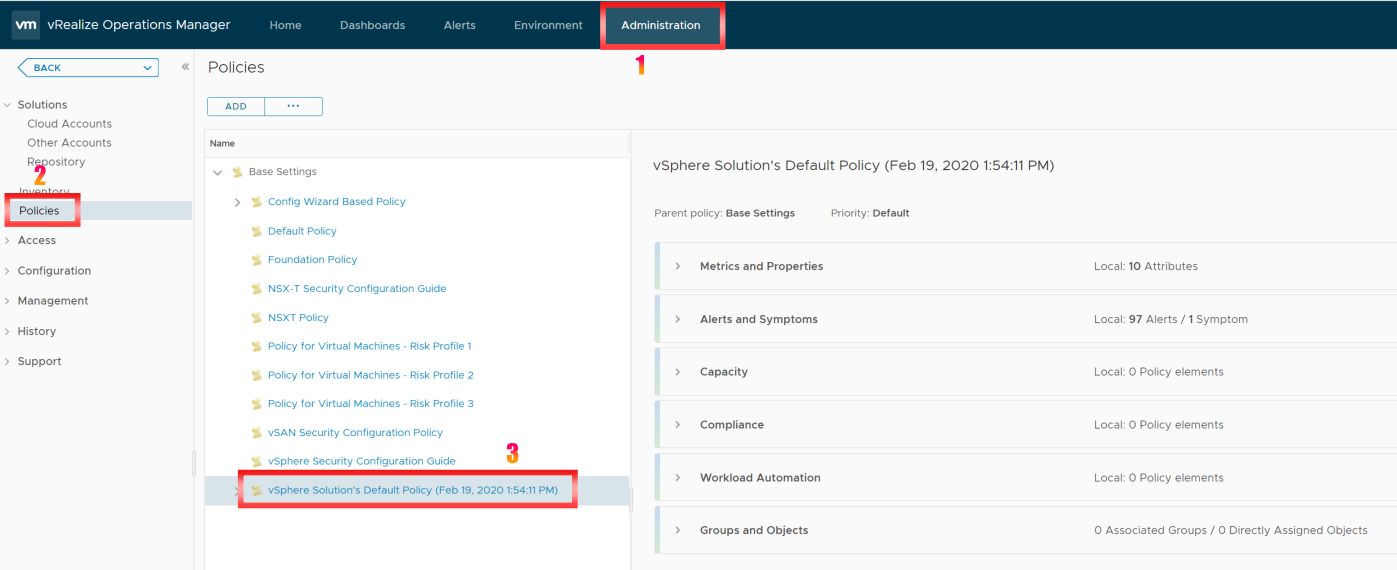
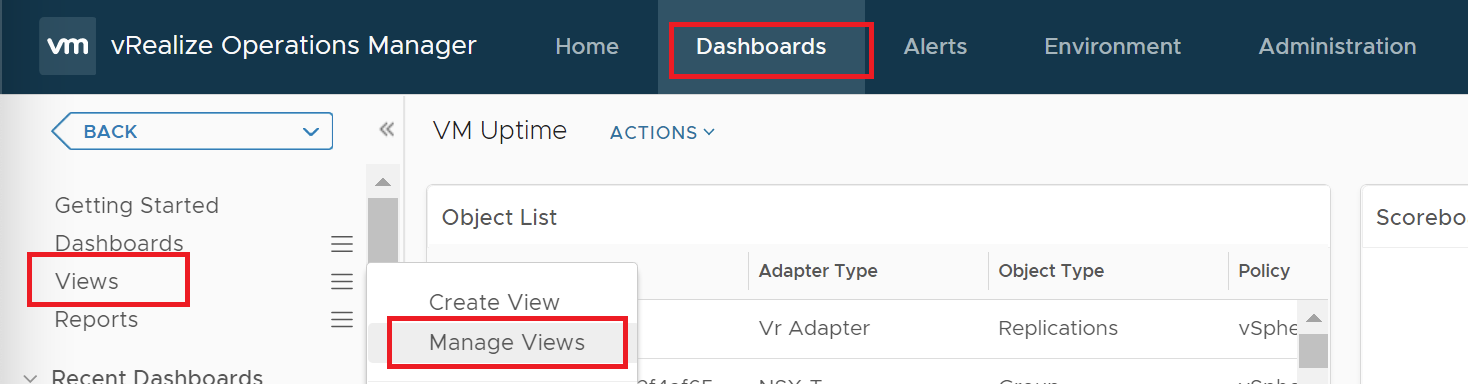
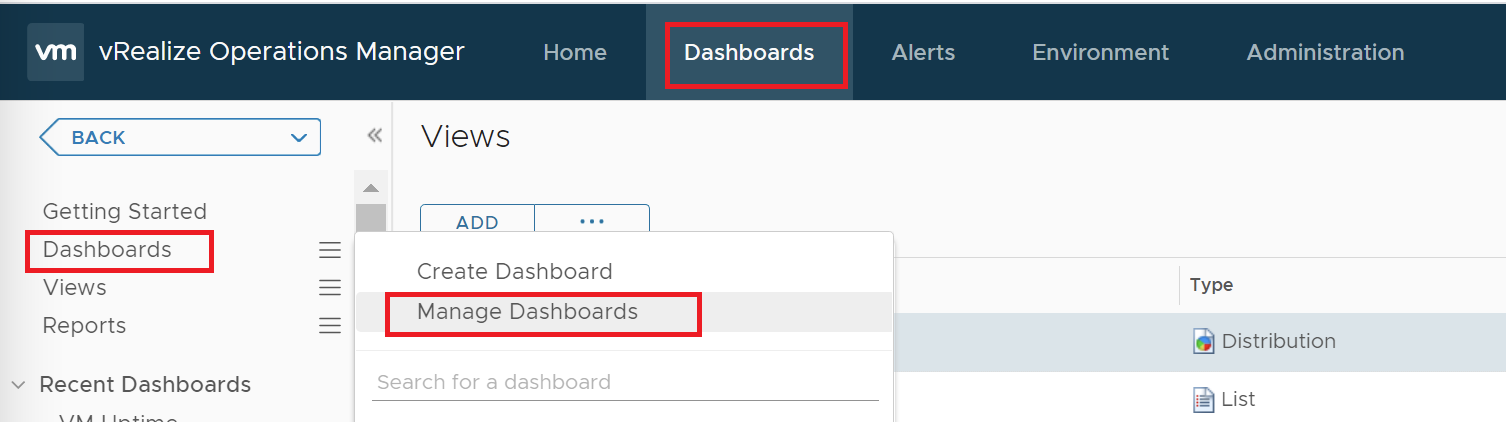
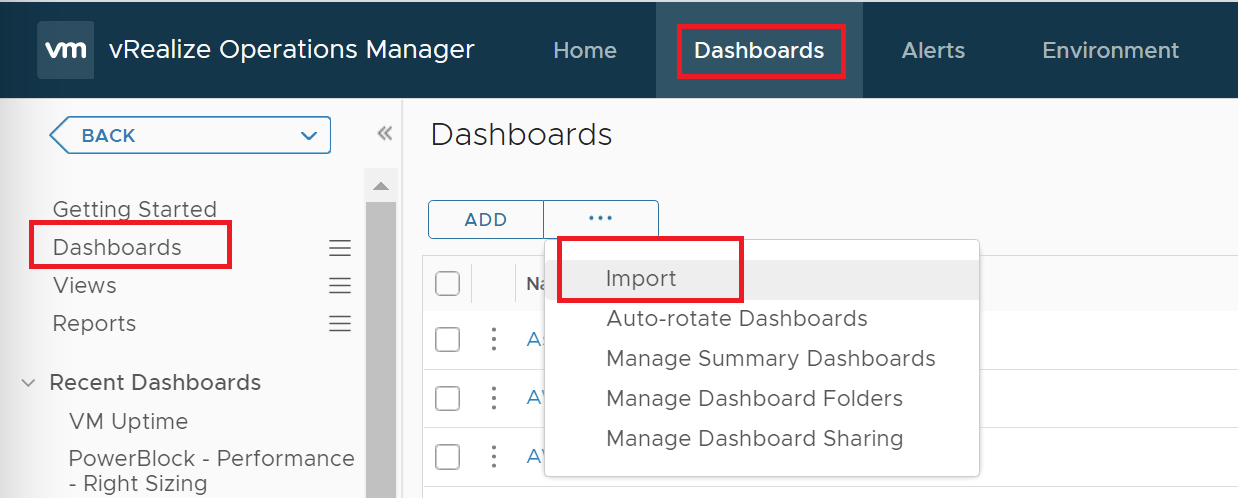
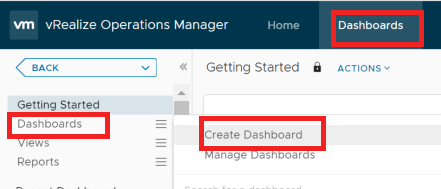
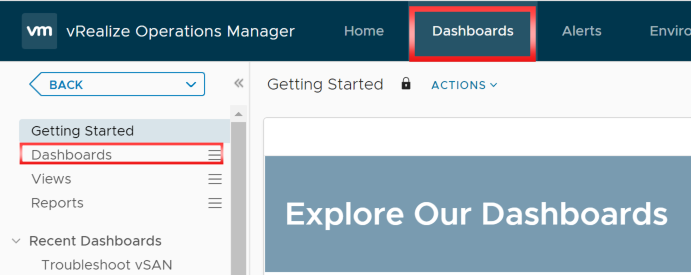
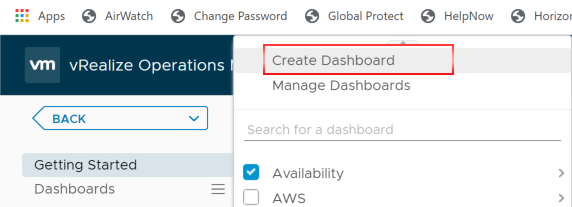
- ทำการ Create vROPs dashboard โดย Select “Dashboards” -> “Dashboards“
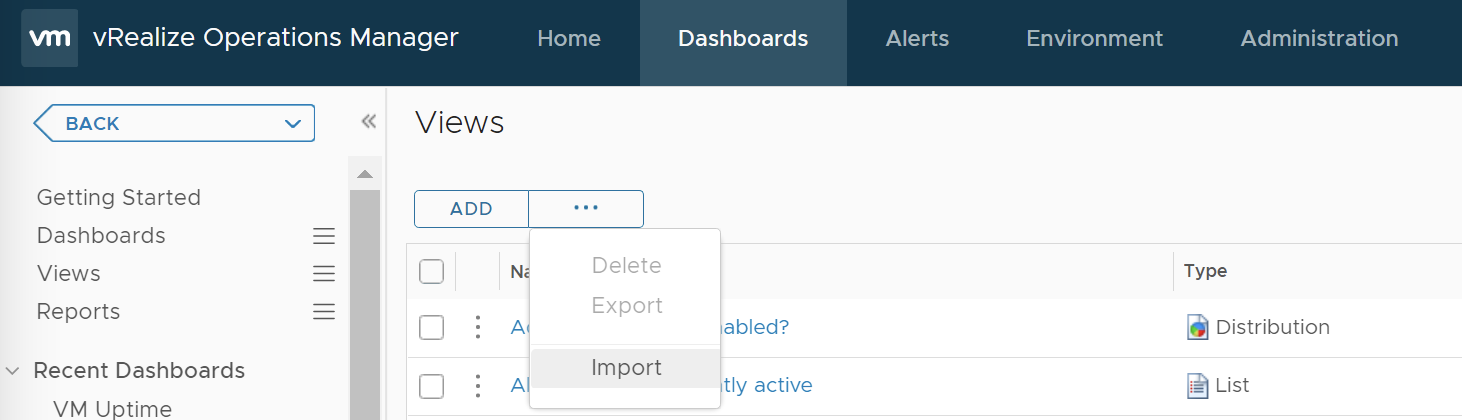
2. ทำการ Select “Create Dashboards“
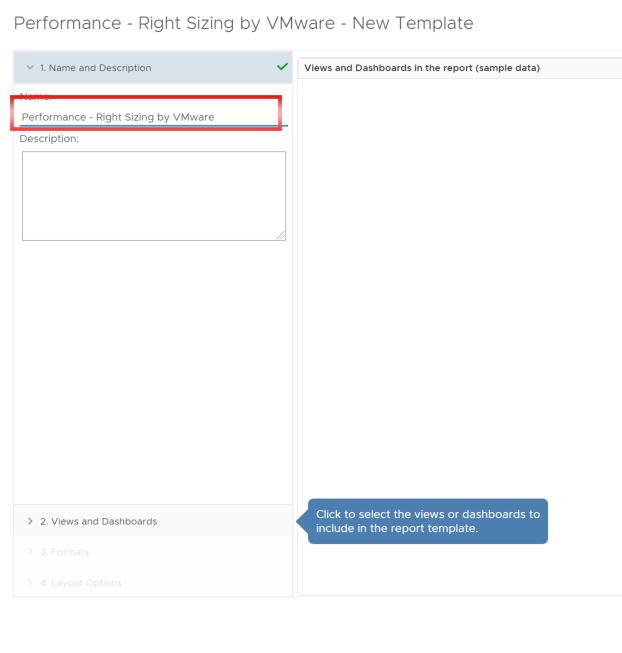
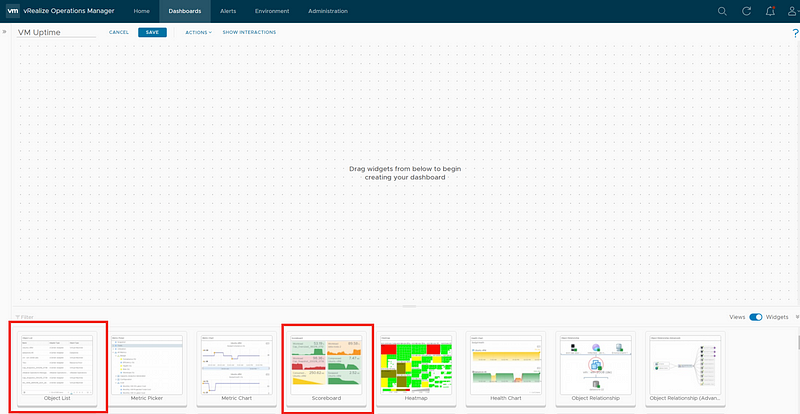
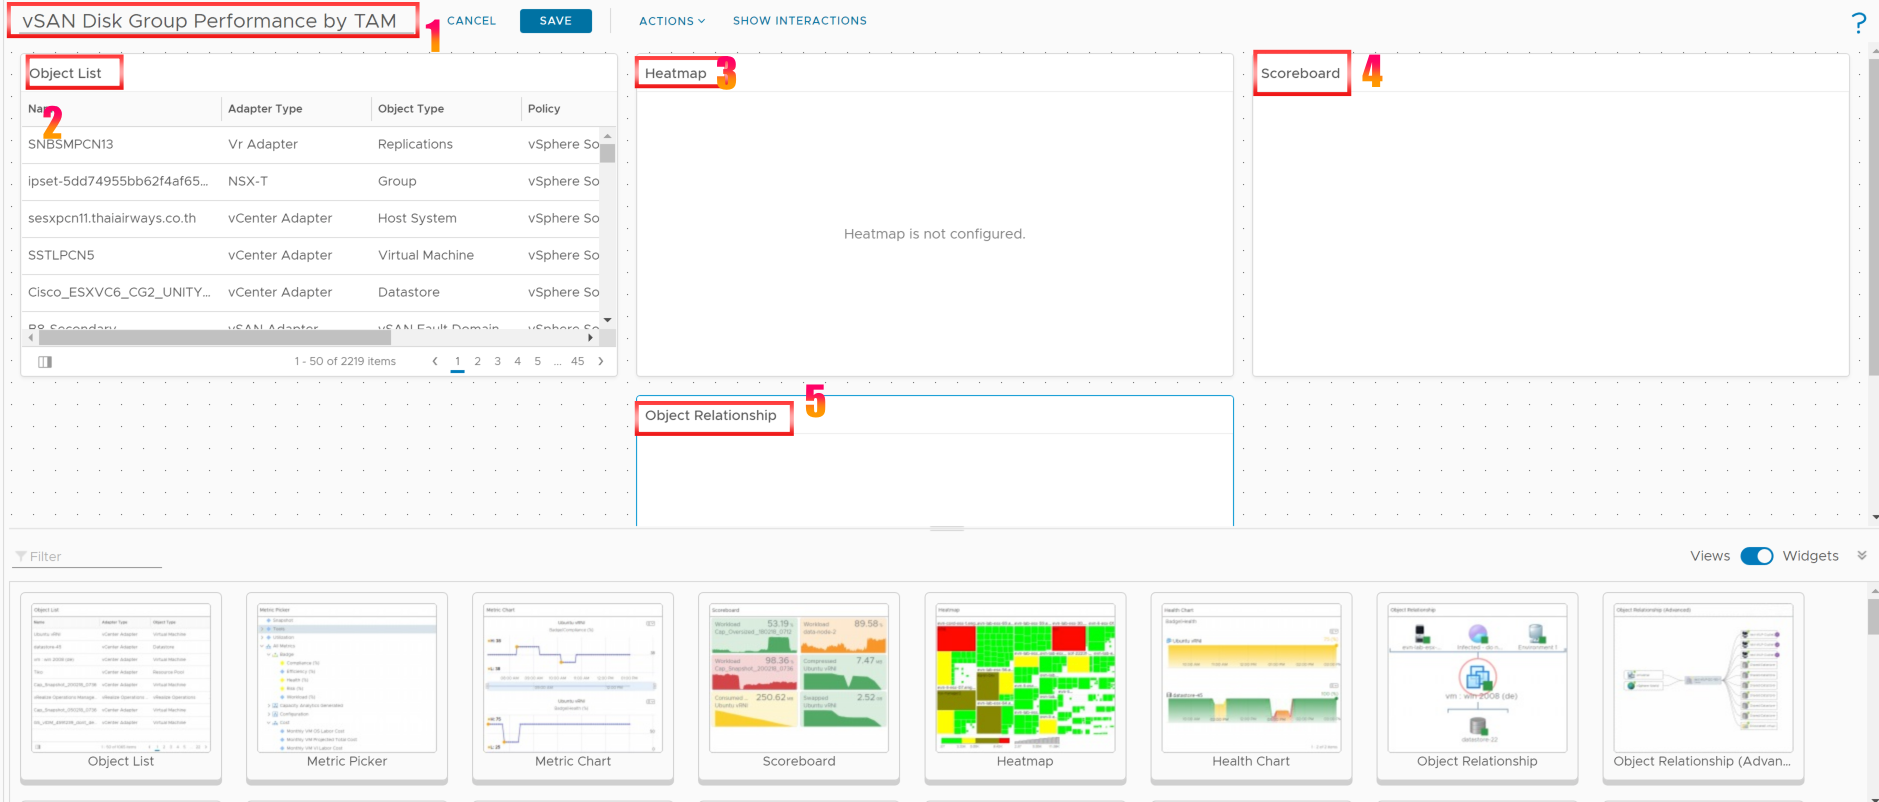
3. เมื่อเราทำการ Create Dashboard แล้ว ก็ใส่ ชื่อ Dashboards (ในบทความนี้จะตั้งชื่อ “vSAN Disk Group Performance by TAM“)
4. ให้ทำการ เพิ่ม Widgets โดย Click ลาก Widget เข้ามาใน พื้นที่ว่าง.
- Object list
- Heat map
- Scoreboard
- Object relationship
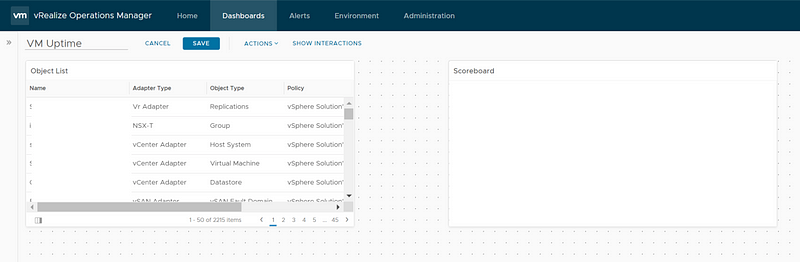
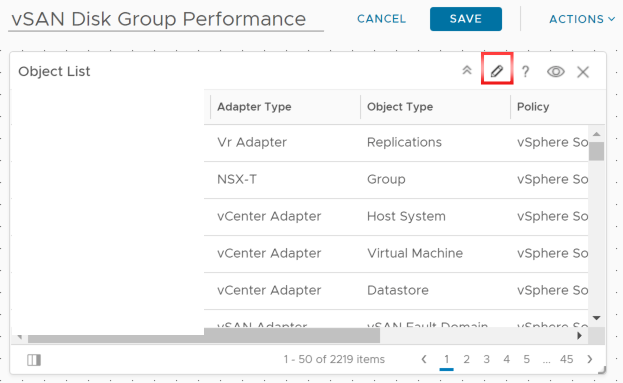
5. ทำการแก้ไข widgets อันแรกคือ “Object list” โดย Click ที่รูปดินสอ “Edit Widget“
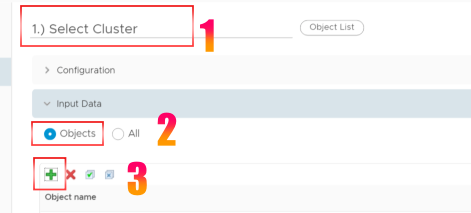
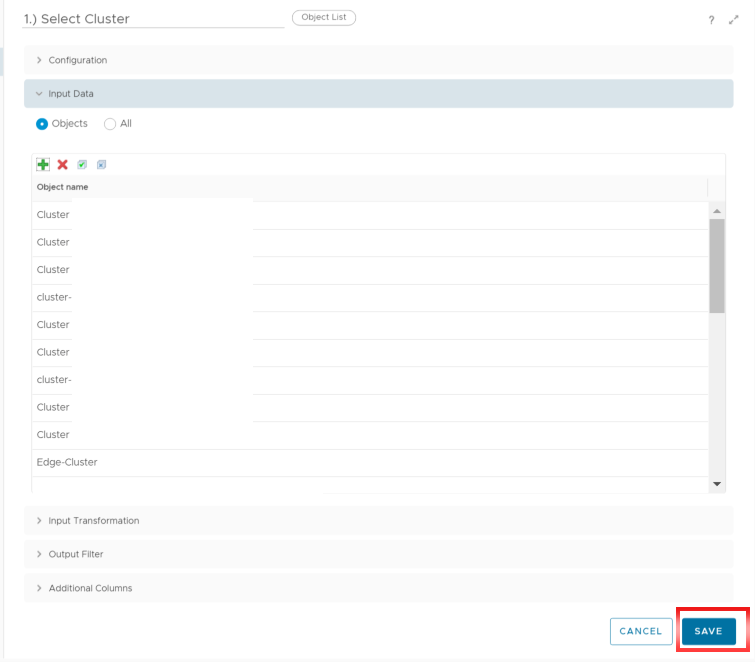
6. ทำการ set ค่า Object list โดยเราจะเลือก input ที่จะแสดงค่า เป็น Cluster ทั้งหมด ให้ใส่ Object list name “1.) Select Cluster “, Select “Input Data“, Select “Object” -> Click “Add“.
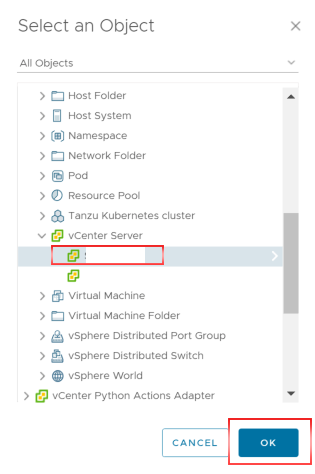
7. จากนั้นให้เราทำการ Add New Object โดยในช่อง Filter ให้ใส่คำว่า “Cluster” แล้ว “Enter” ให้ Click “OK“
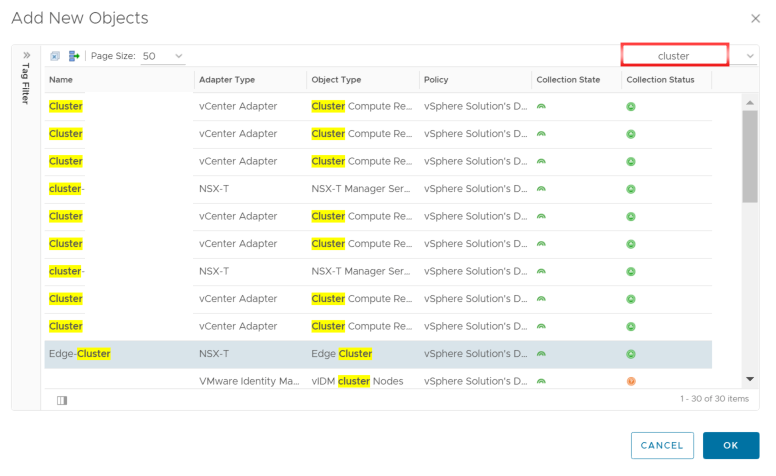
8. เราก็จะได้ Cluster ทั้งหมด ทำการ Click “SAVE“
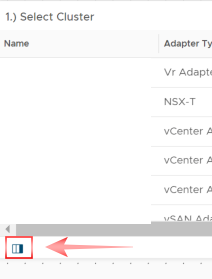
9. Click แสดง columns ด้านล่างของ “Object list” widgets
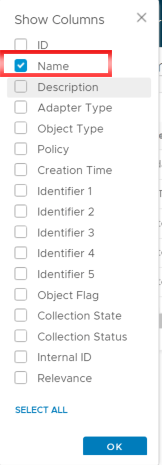
10. โดยเราจะ Uncheck ทุกอย่างยกเว้น “Name“
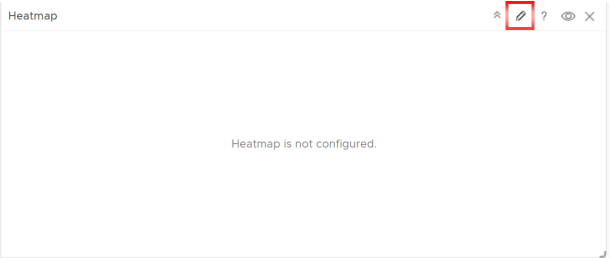
11. ต่อมาเราจะทำการ configure “Heat map“. ทำการ click “Edit widget” ที่รูปดินสอ ตรงมุมขวาบน
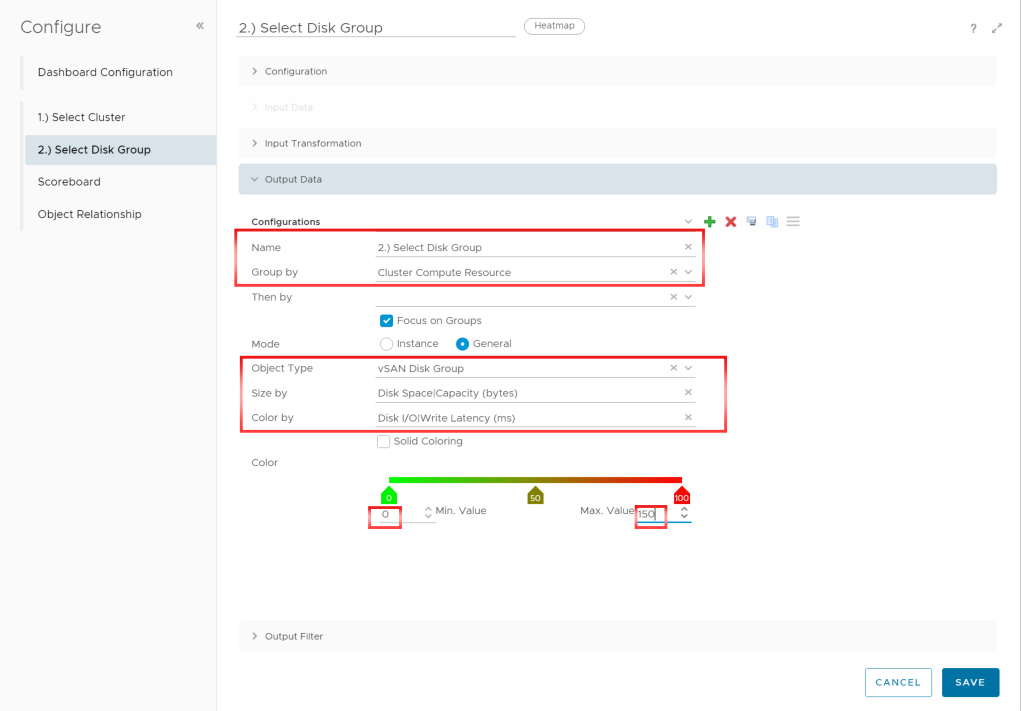
12. ใส่ชื่อของ Heat map “2.) Select Disk Group” สิ่งที่เราต้องการจะแสดง ใน Heat map คือ Disk group ทั้งหมดใน Cluster ที่เราเลือก
- Name: 2.) Select Disk Group
- Group by: Cluster Compute Resource
- Object Type: vSAN Disk Group
- Size by: Disk Space|Capacity (bytes)
- Color by: Disk I/O|Write Latency (ms)
- Color: Min Value 0 | Max Value 150
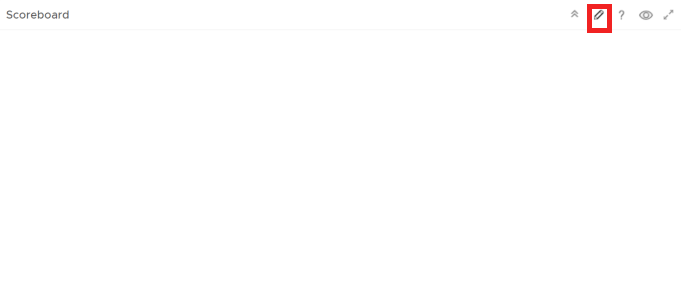
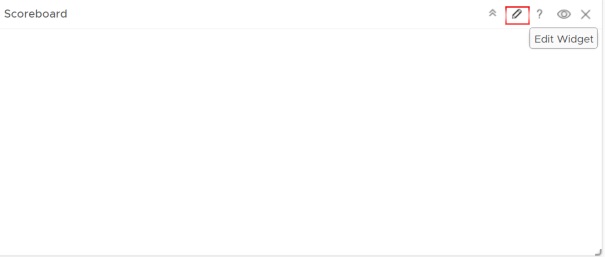
13. ต่อมาทำการ configure widget “Scoreboard“. ทำการ click “Edit widget” ที่รูปดินสอ ตรงมุมขวาบน
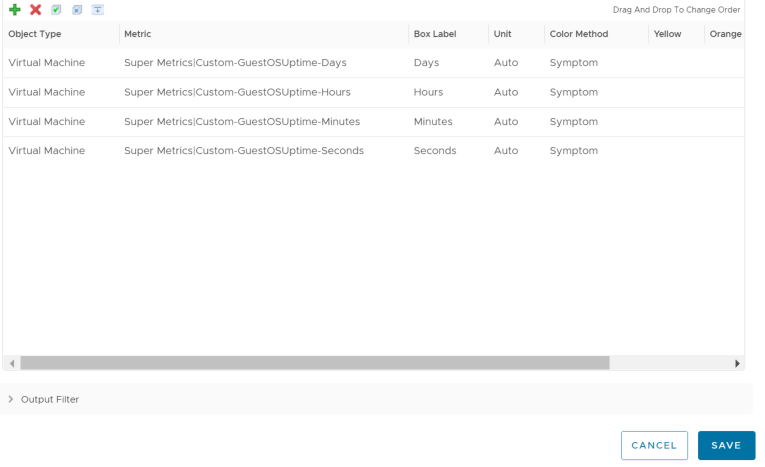
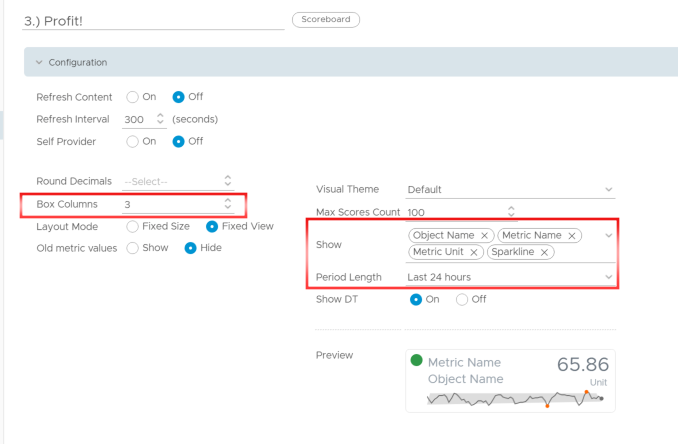
14. ใส่ชื่อของ Scoredboard name “3.) Profit!“. ทำการ Configure Scoredboard ตามรูปด้านล่าง
- Box Columns: 3
- Show: Object Name, Metric Name, Metric Unit, Sparkline
- Period Length: Last 24 hours
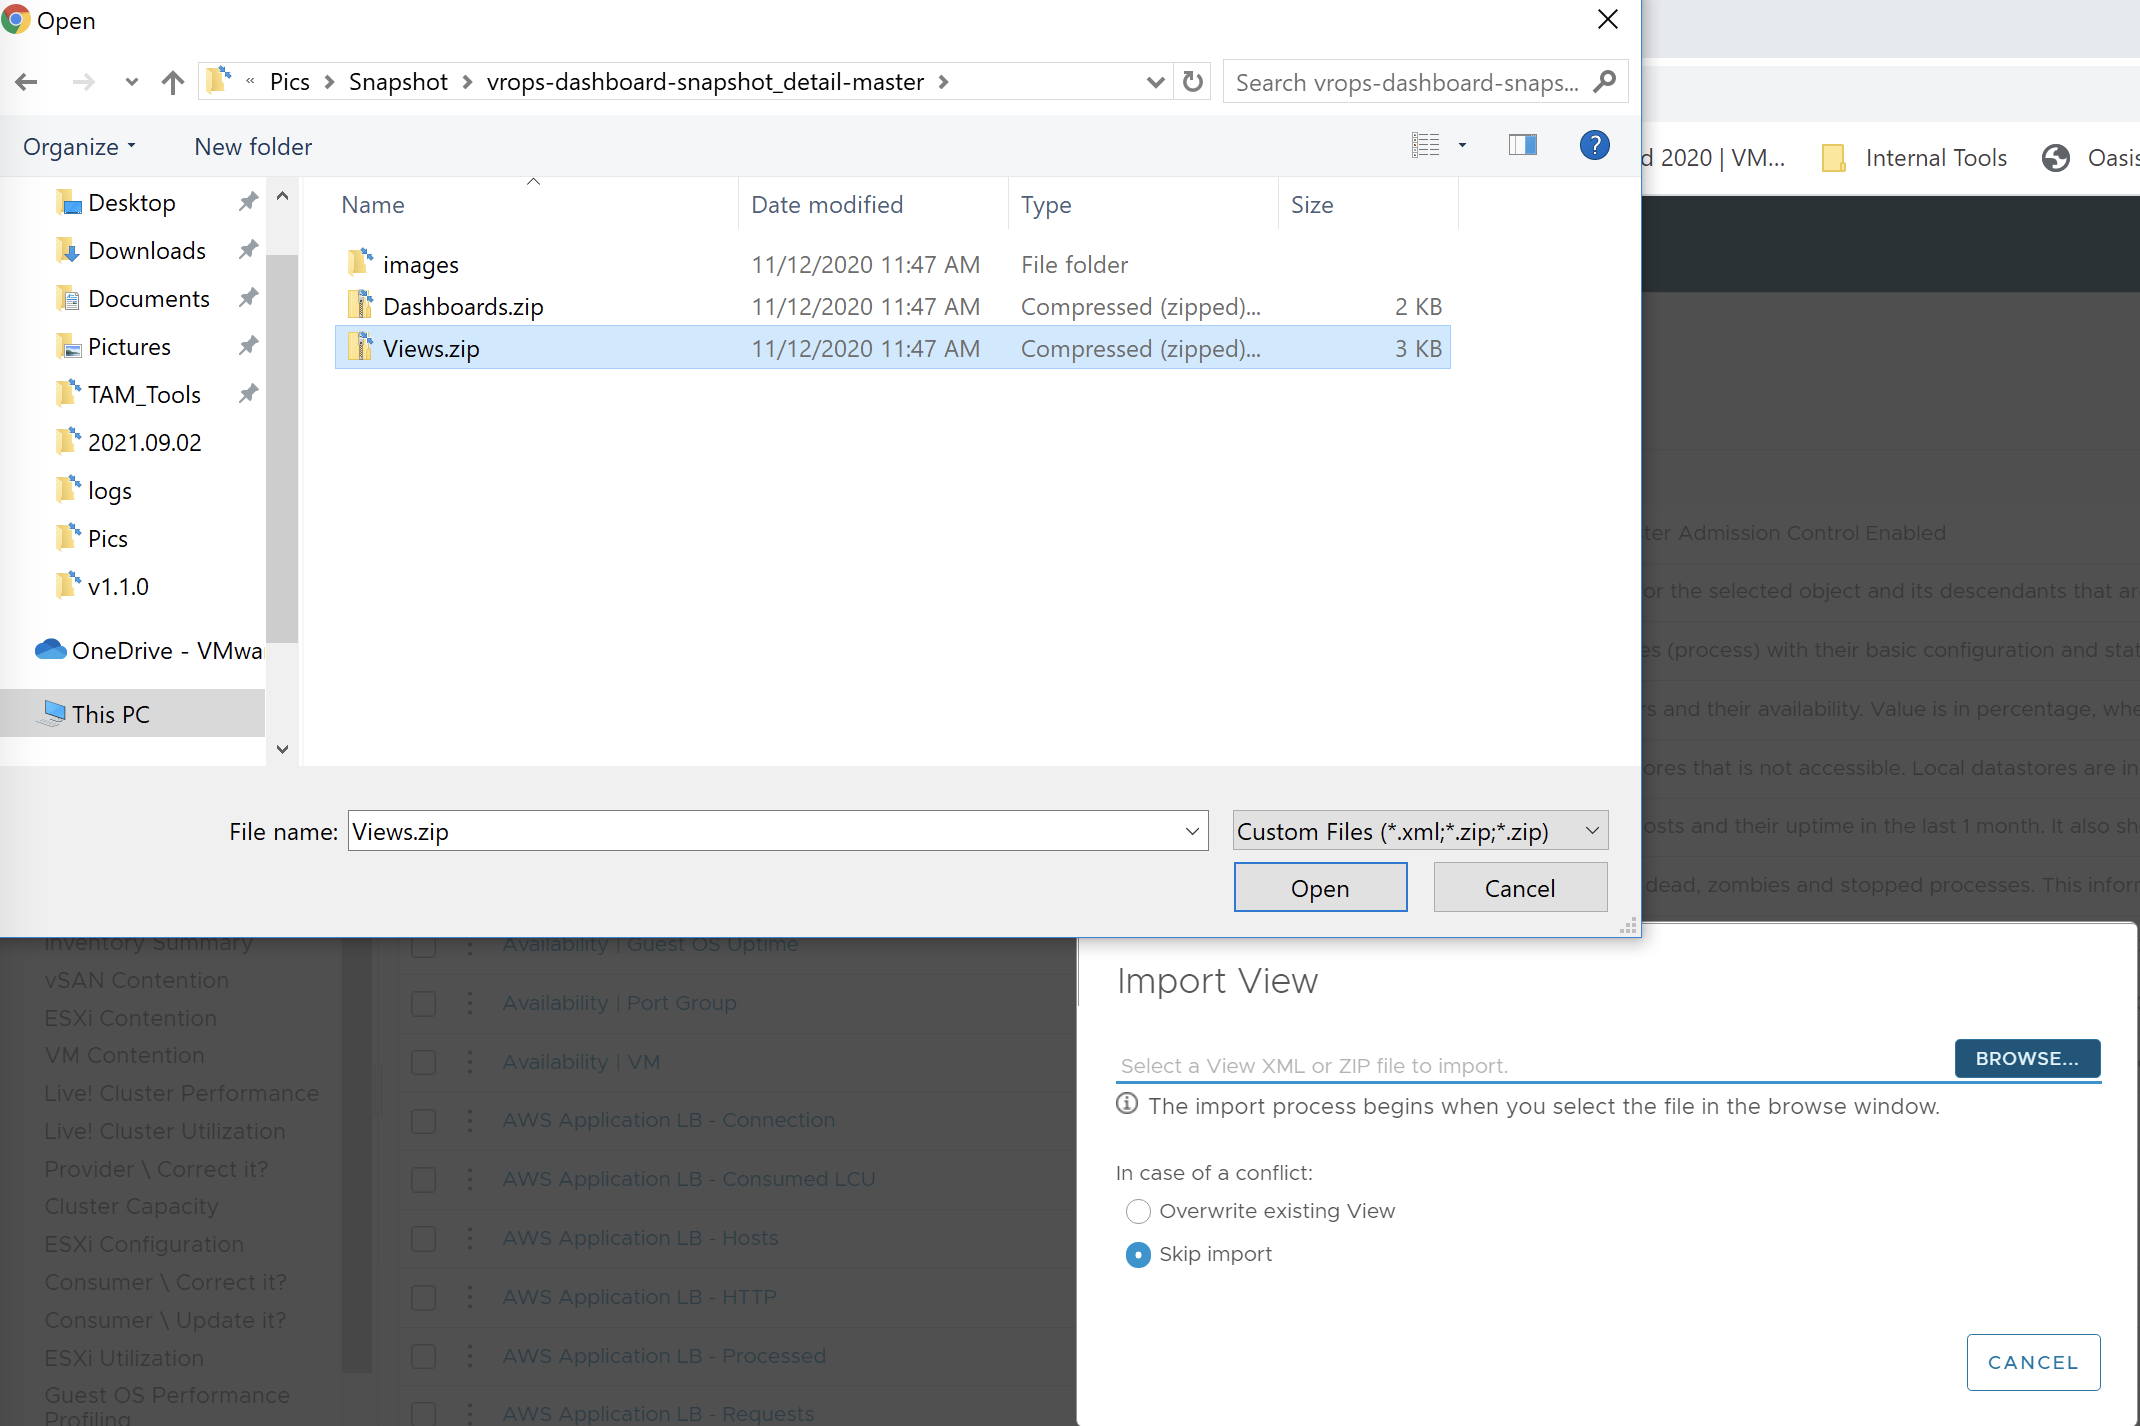
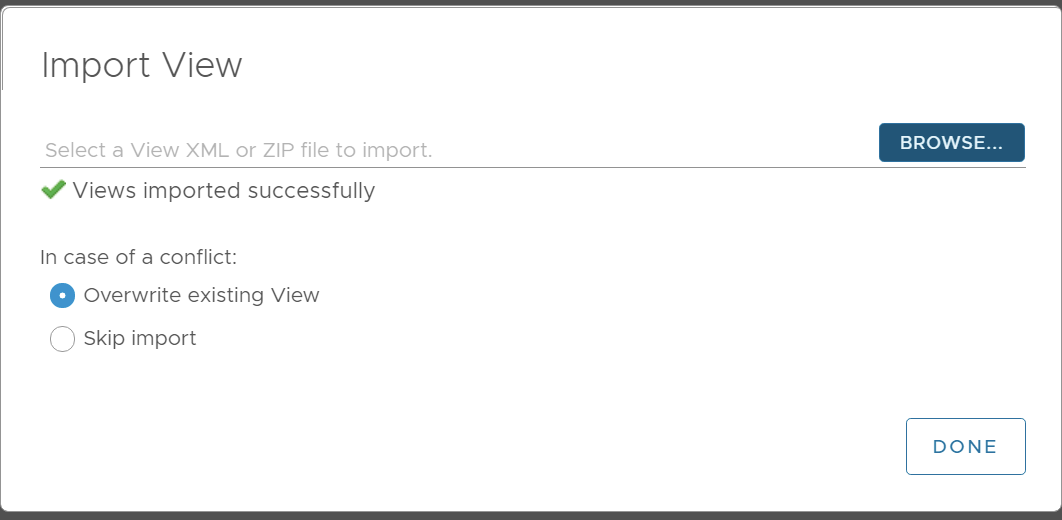
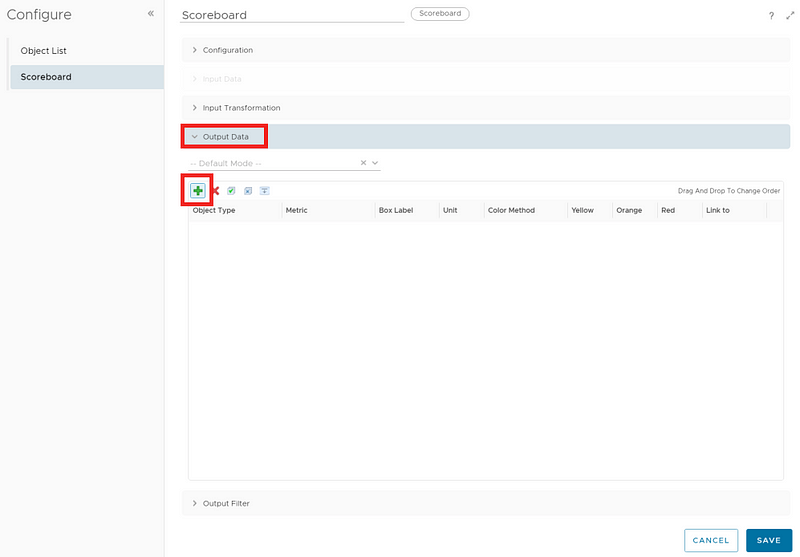
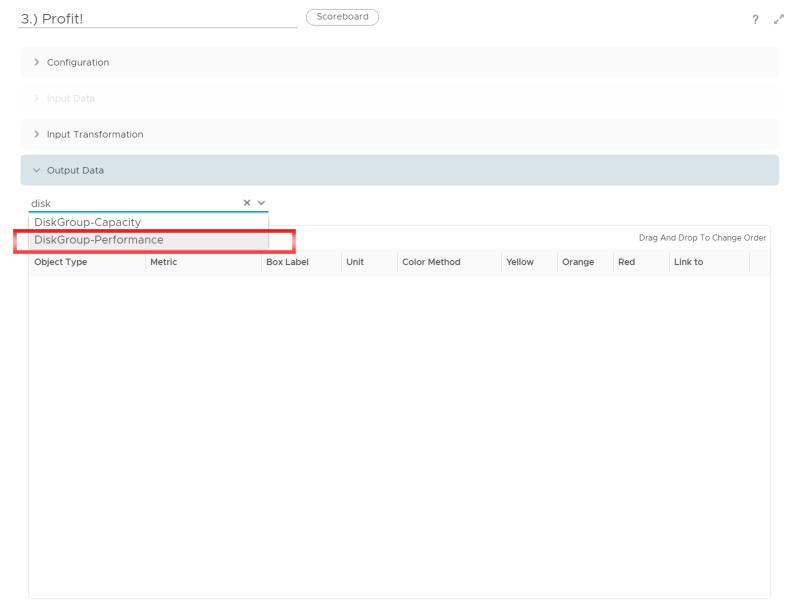
15. Output Data ให้เลือก “DiskGroup-Performance” แล้ว Click “SAVE“
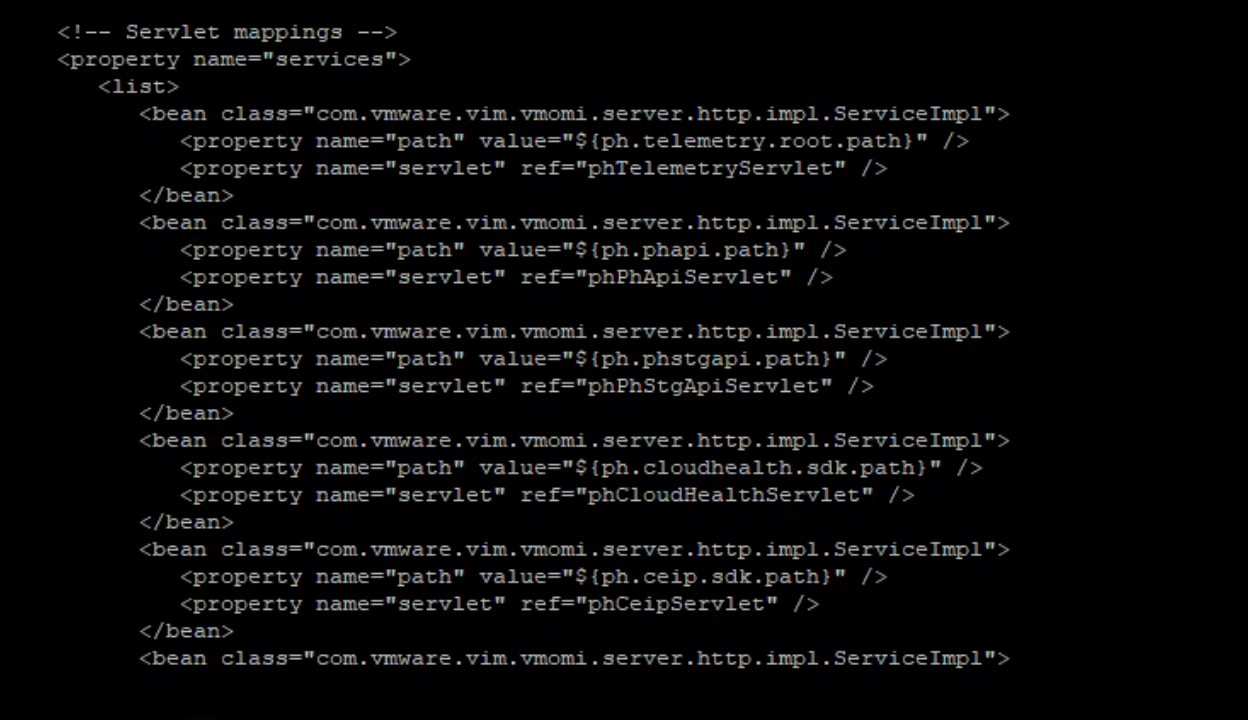
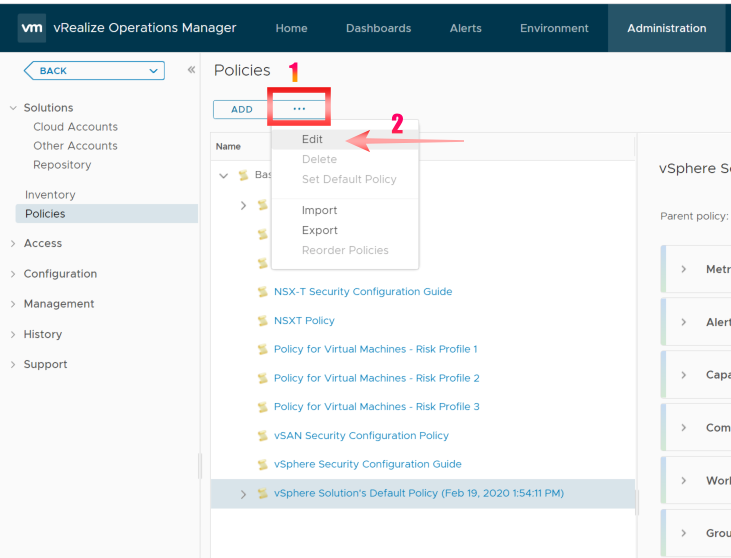
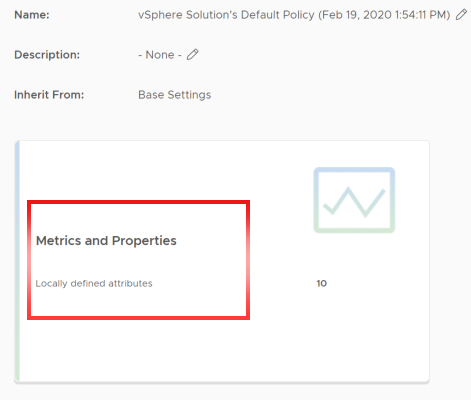
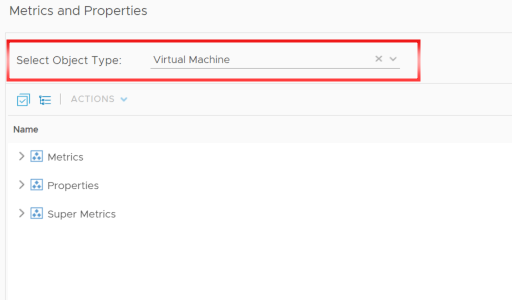
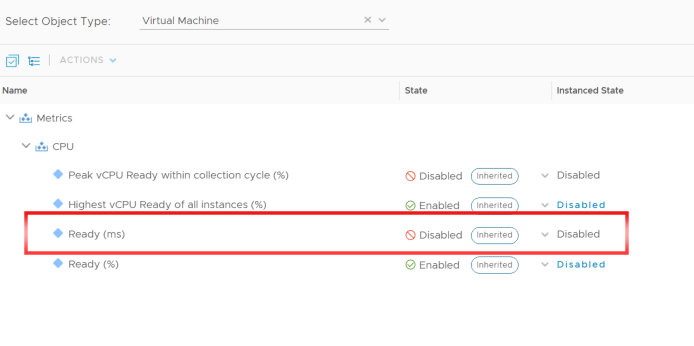
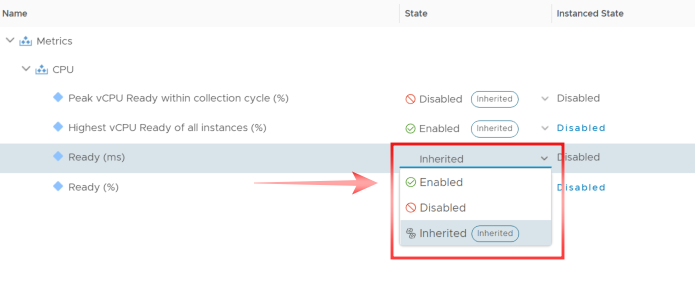
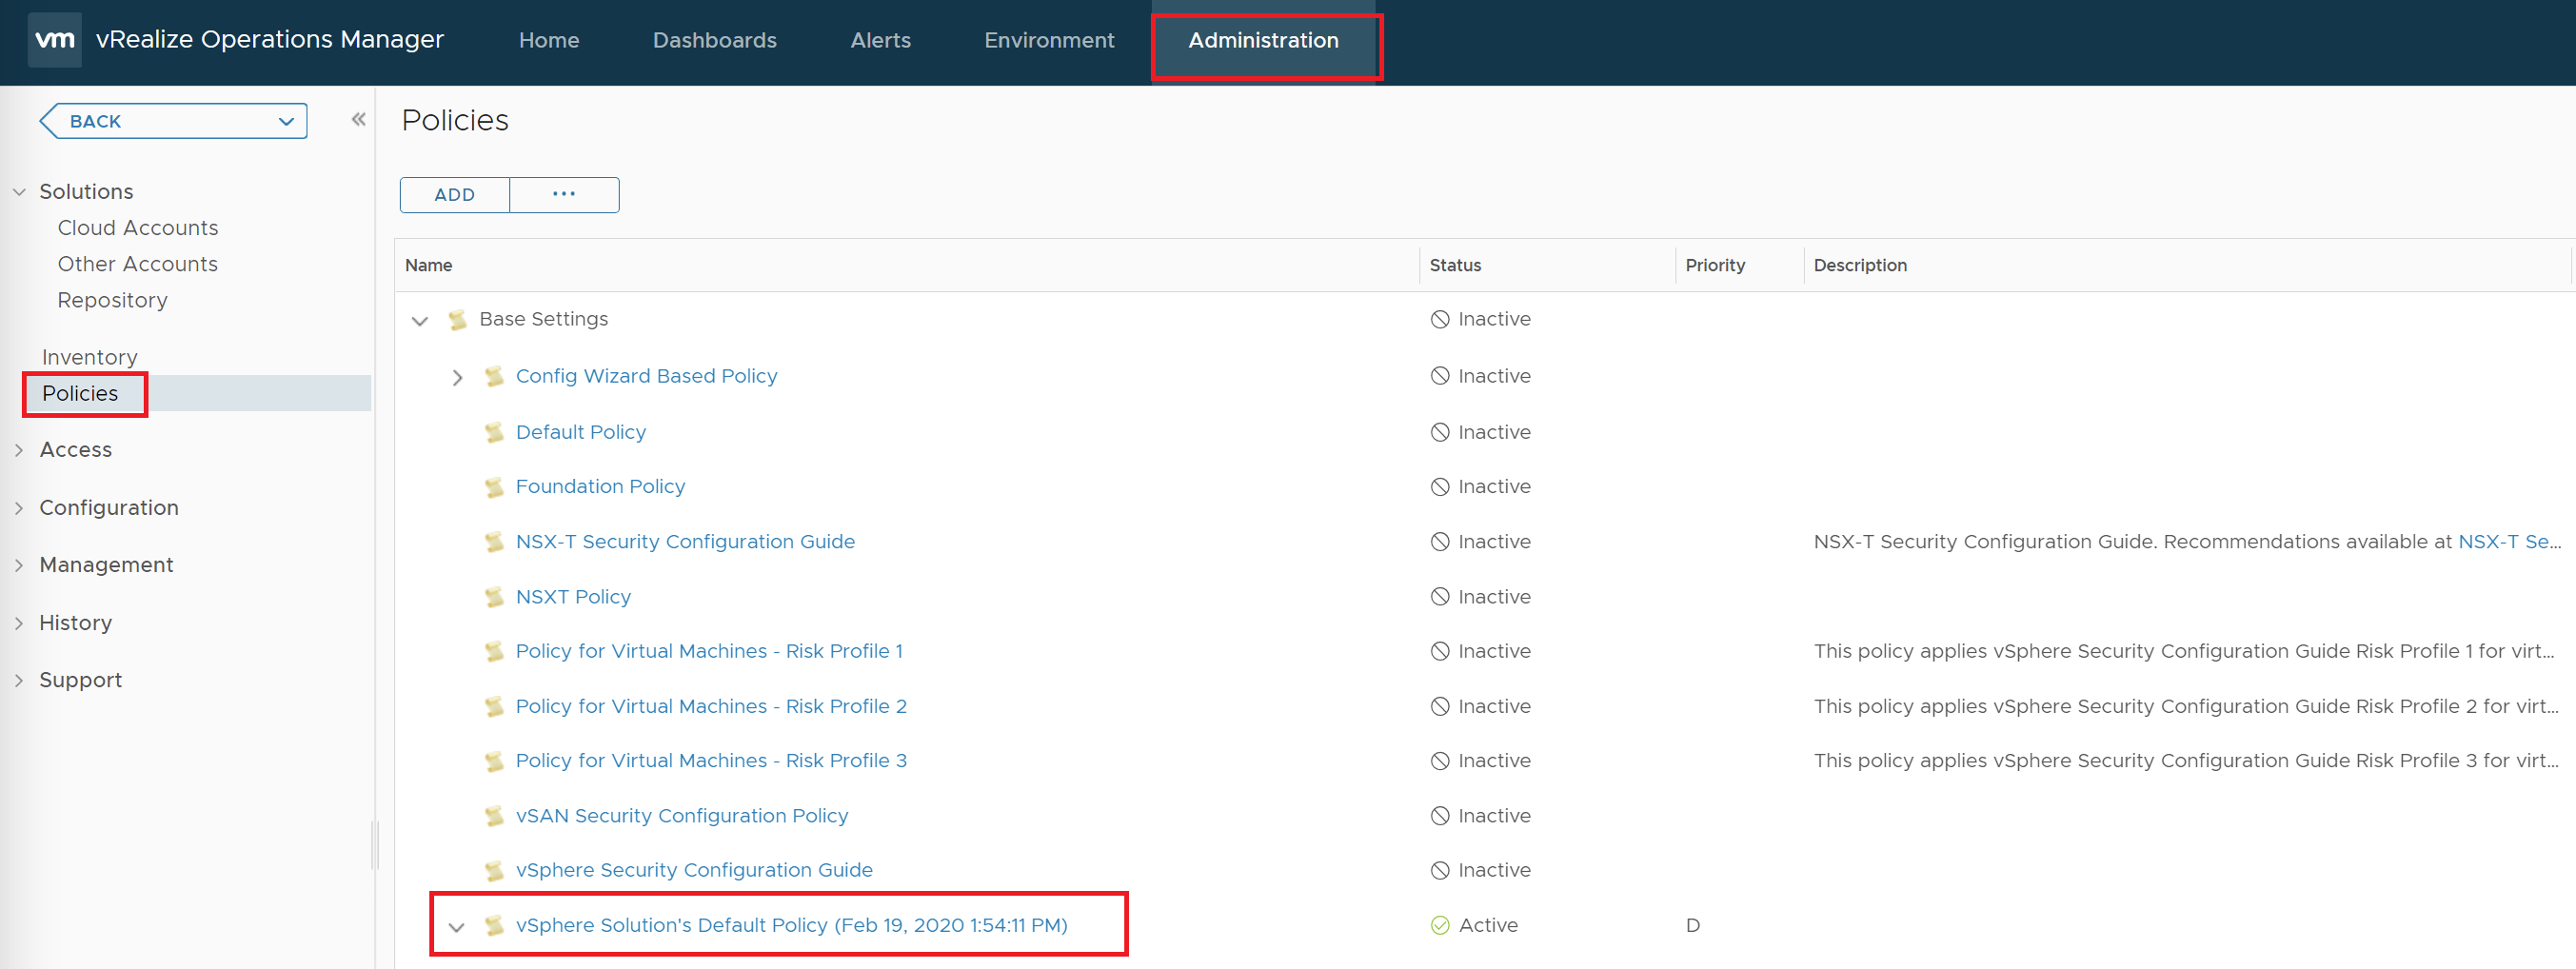
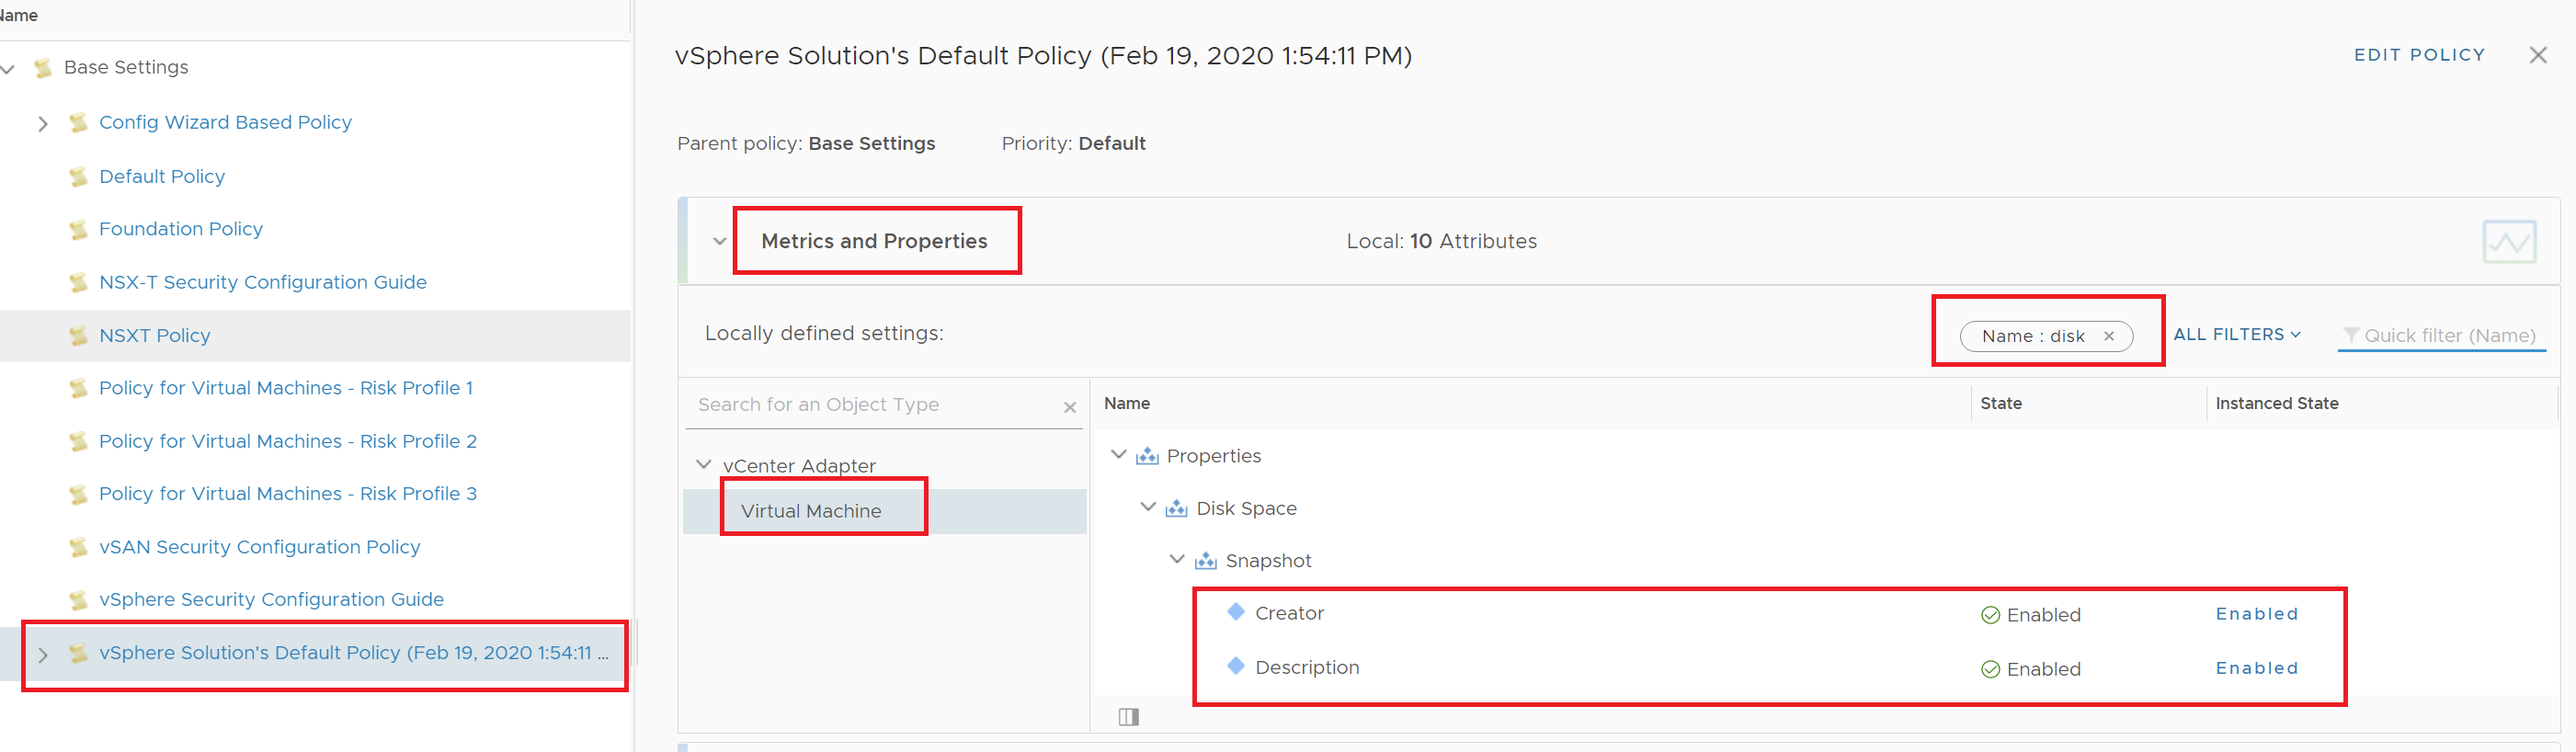
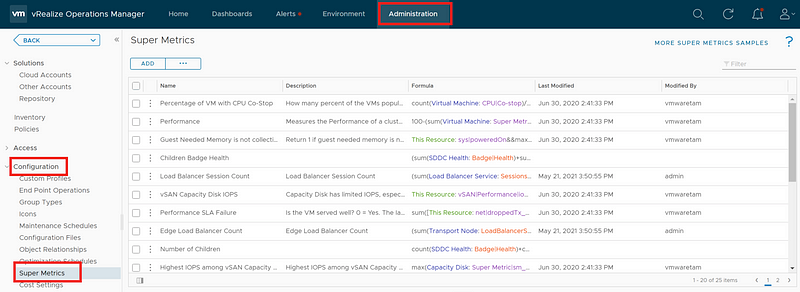
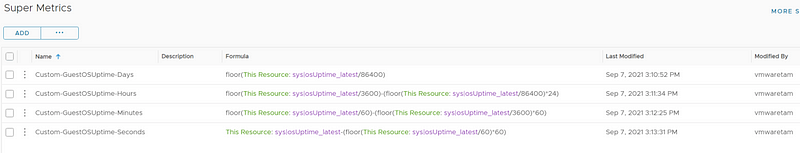
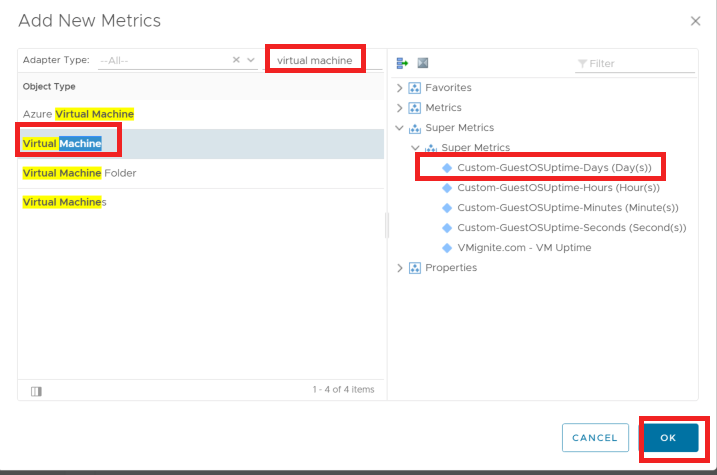
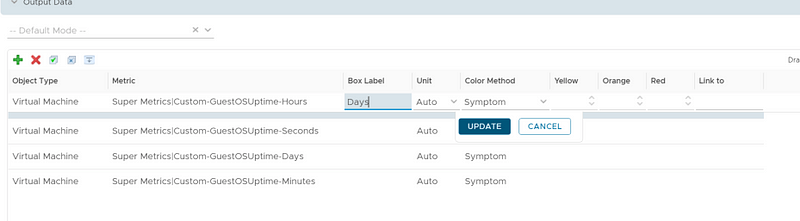
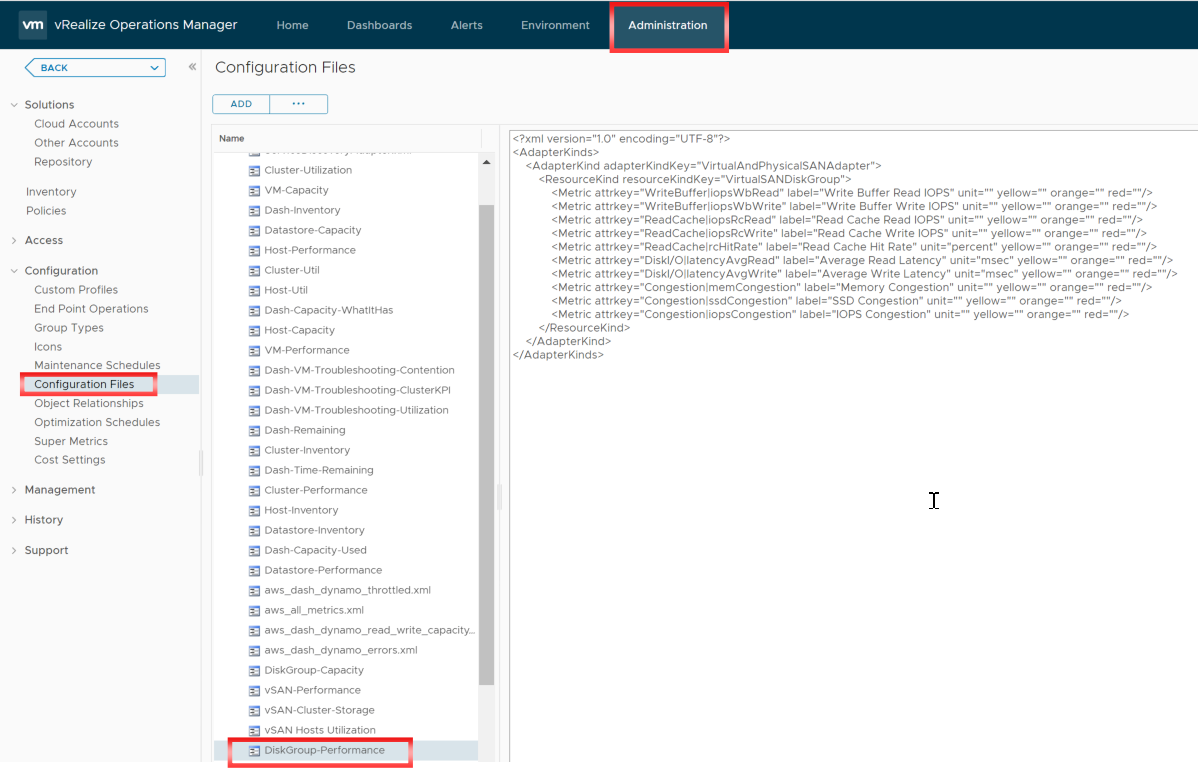
16. Metrics ที่เรานำมาใช้ในการ configuration จะเป็น XML format ซึ่งเราสามารถทำการแก้ไข ได้ โดย location จะอยู่ที่ Administrator -> Configuration File -> DiskGroup-Performance.
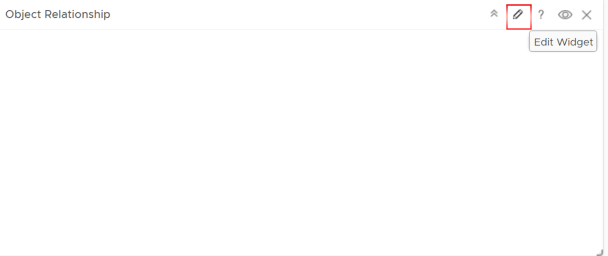
17. Widget สุดท้าย “Object Relationship“. ทำการ click “Edit widget” ที่รูปดินสอ ตรงมุมขวาบน
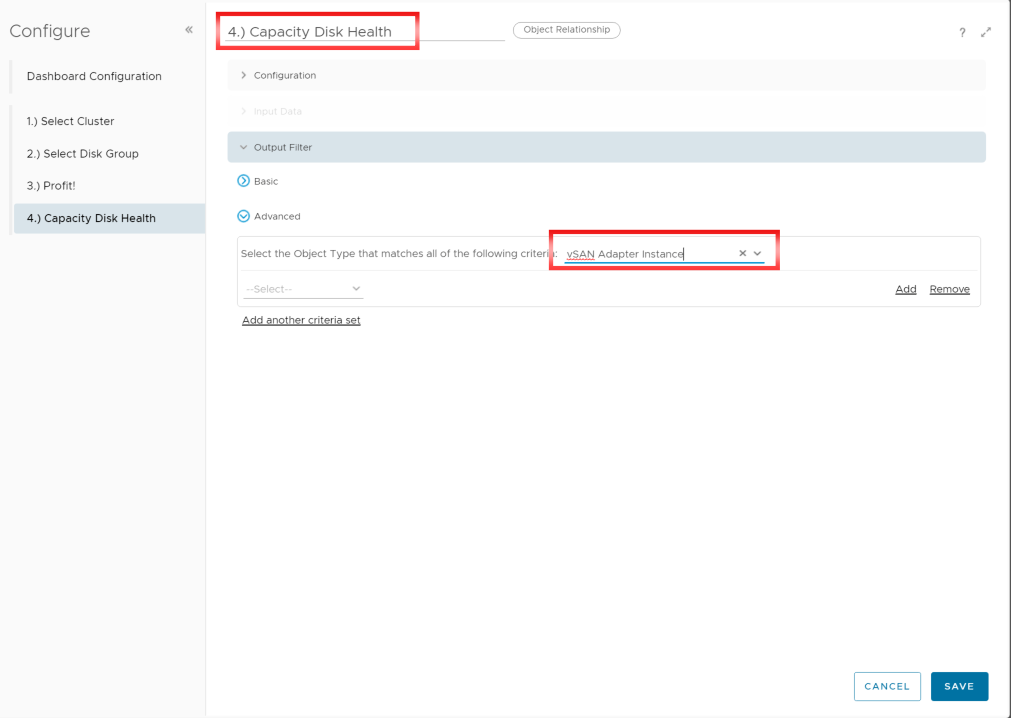
18. ใส่ชื่อ widget “4.) Capacity Disk Health“. ทำการเลือก Adapter types -> “vSAN adapter” ให้ Click “SAVE“
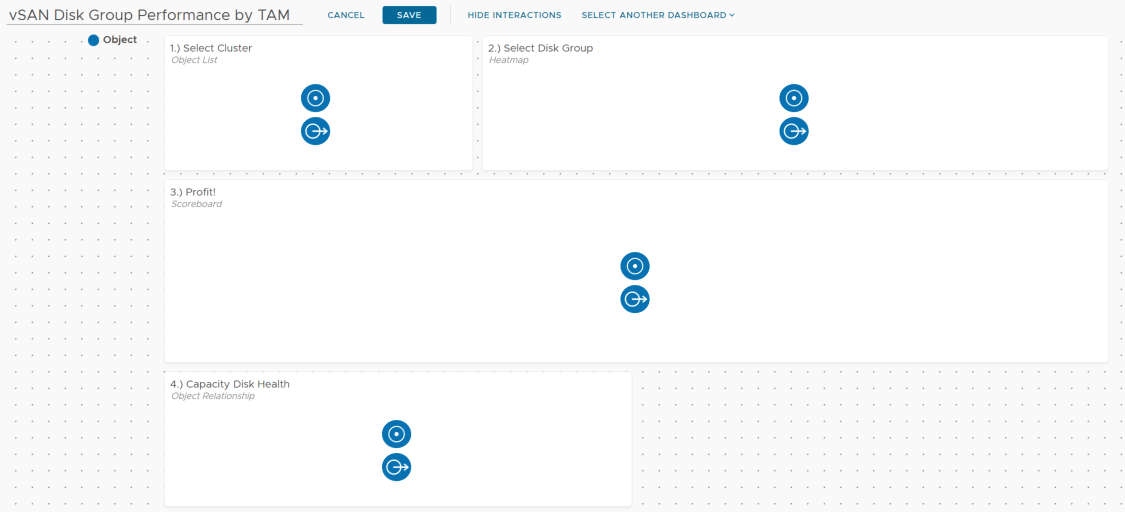
19. หลังจากเราทำการ configured widgets เสร็จเรียบร้อยแล้ว ขั้นตอนที่สำคัญคือทำการ connect widget ให้ Interaction ด้วยกัน
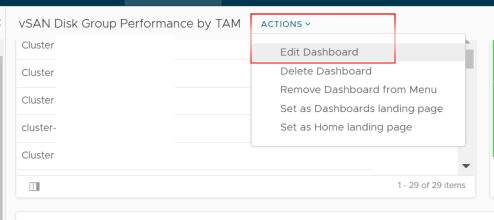
Click “ACTIONS” -> “Edit Dashboard“
ทำการ ลากเส้น Interaction ระหว่าง Widget
- 1.) Select Clsuter –> 2.) Select Disk Group
- 2.) Select Disk Group –> 3.) Profit!
- 2.) Select Disk Group –> 4.) Capacity Disk Health
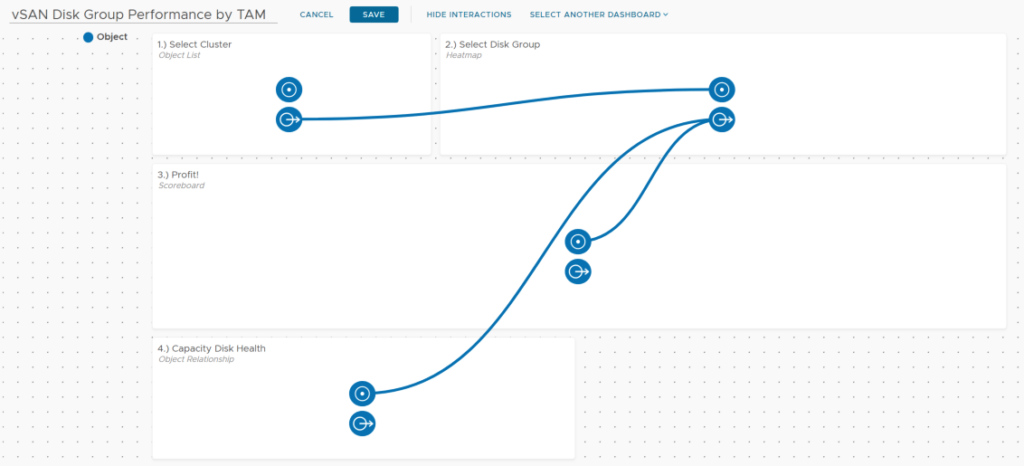
20. Click “SAVE“
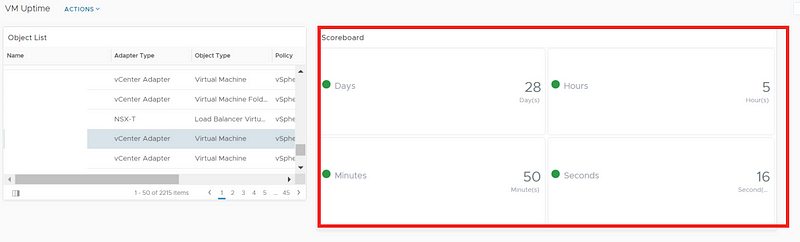
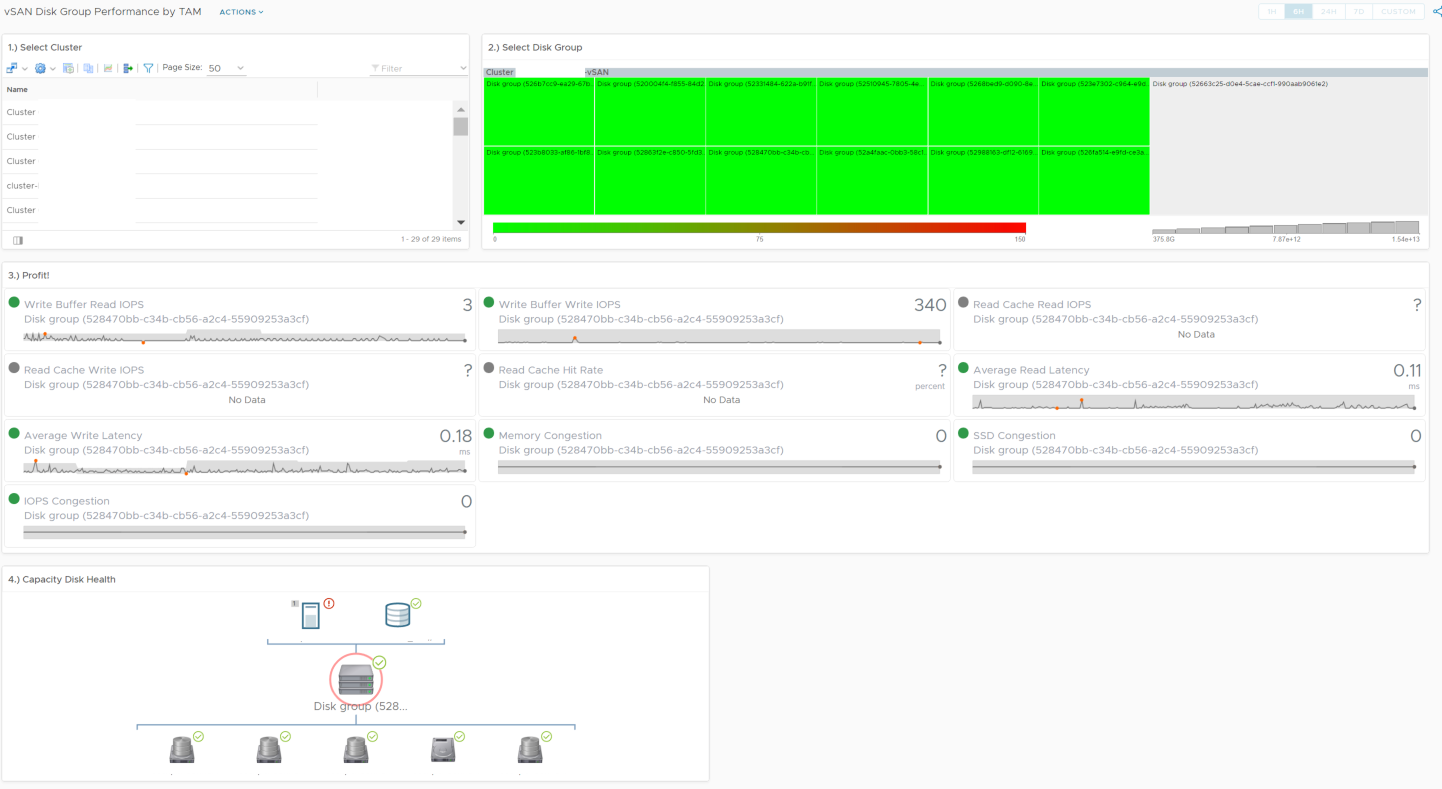
21. การทำงานของ Dashbaord
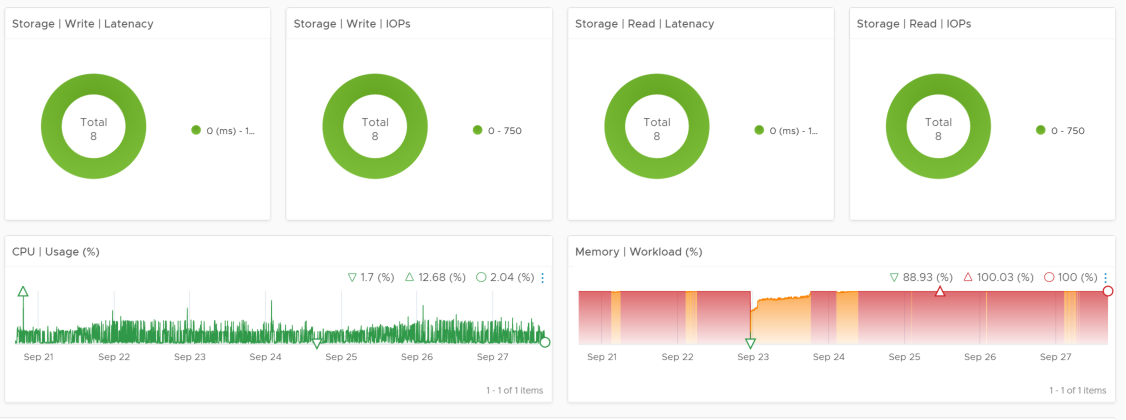
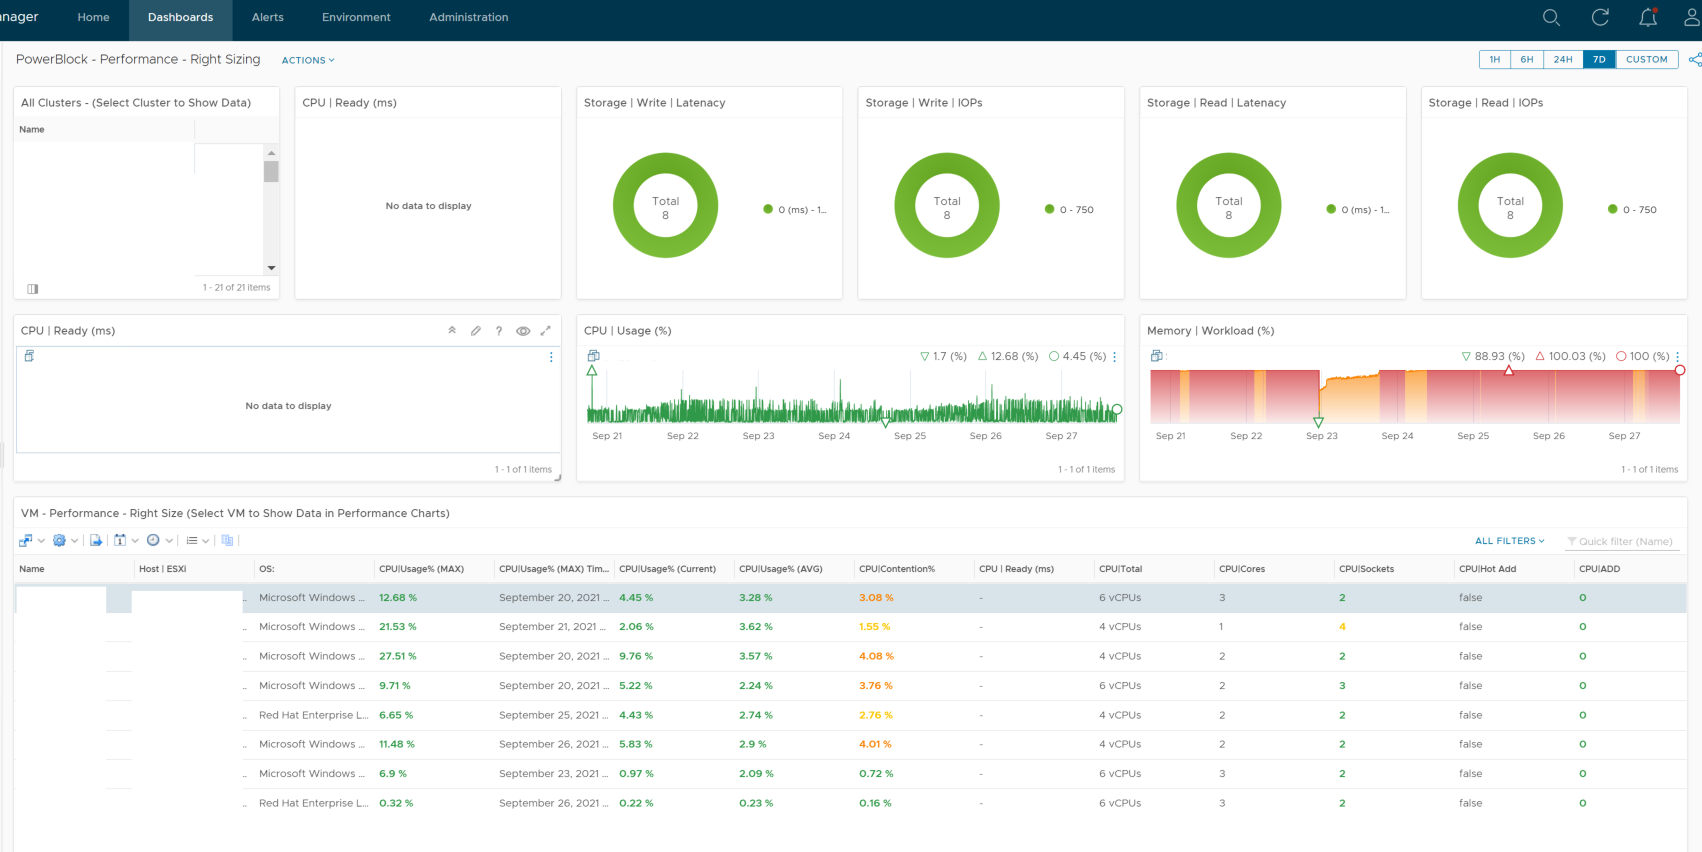
เมื่อเราทำการ Select Cluster ในช่อง 1.) Select Cluster ก็จะแสดง disk group ในช่อง 2. ) Select Disk Group และเมื่อเราทำการ click เลือก disk group ก็จะแสดงค่า Write / Read / IOP ต่างๆใน 3.) Profit! รวมถึง แสดงค่า Capacity Disk Healt ใน 4.) Capacity Disk Health
!!!หวังว่าคงเป็นประโยชน์ ในการ Monitor vSAN Disk group นะครับ!!!