8.Once downloaded, use the Admin UI at https://your_ops_fqdn_here/admin. Navigate to Software Update – INSTALL A SOFTWARE UPDATE and point it to your APUAT pak file.
9.And then apply HF6 via the Software Update page, BROWSE to your file.
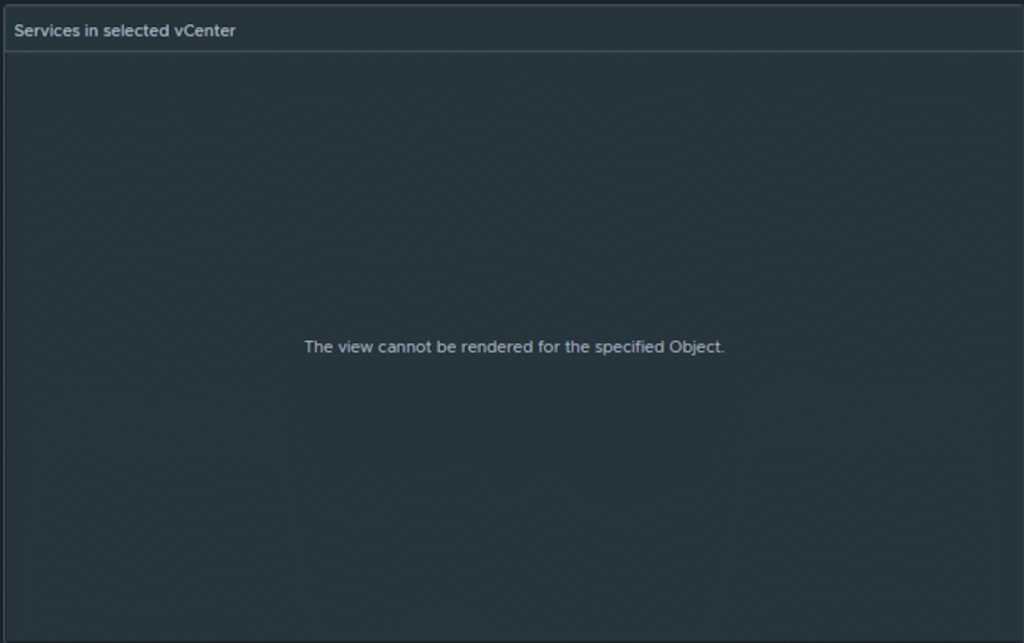
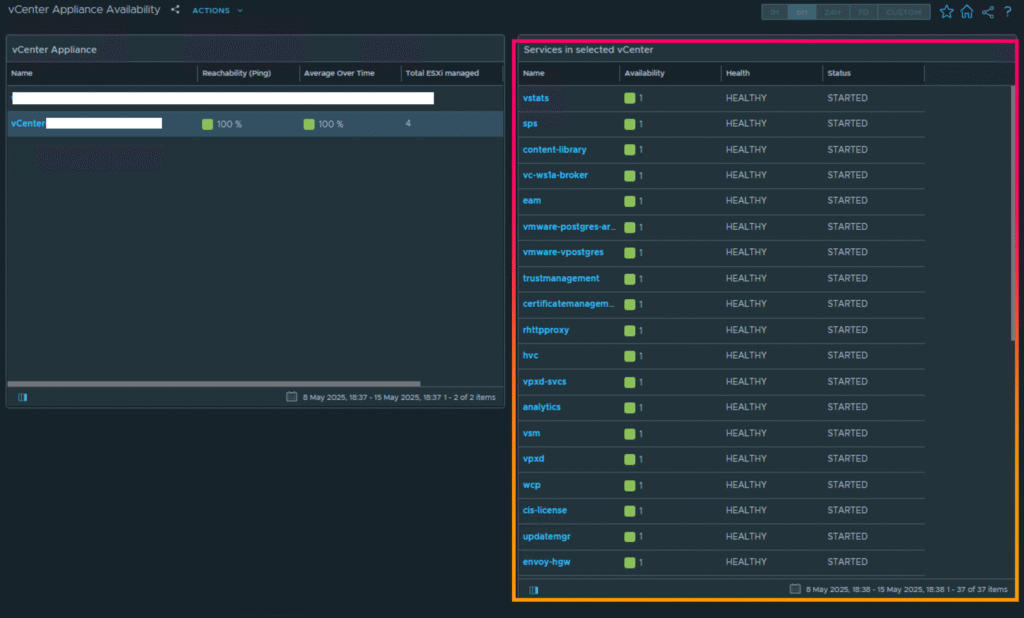
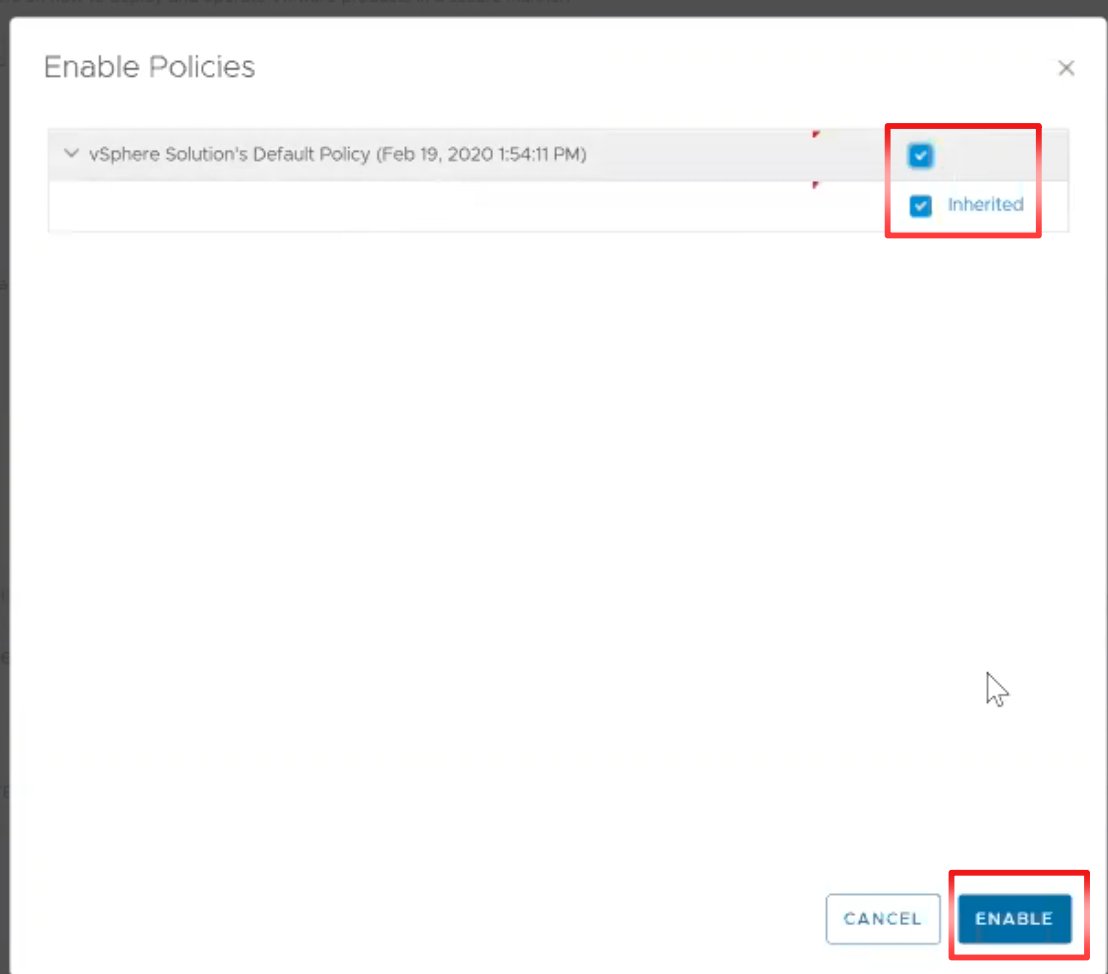
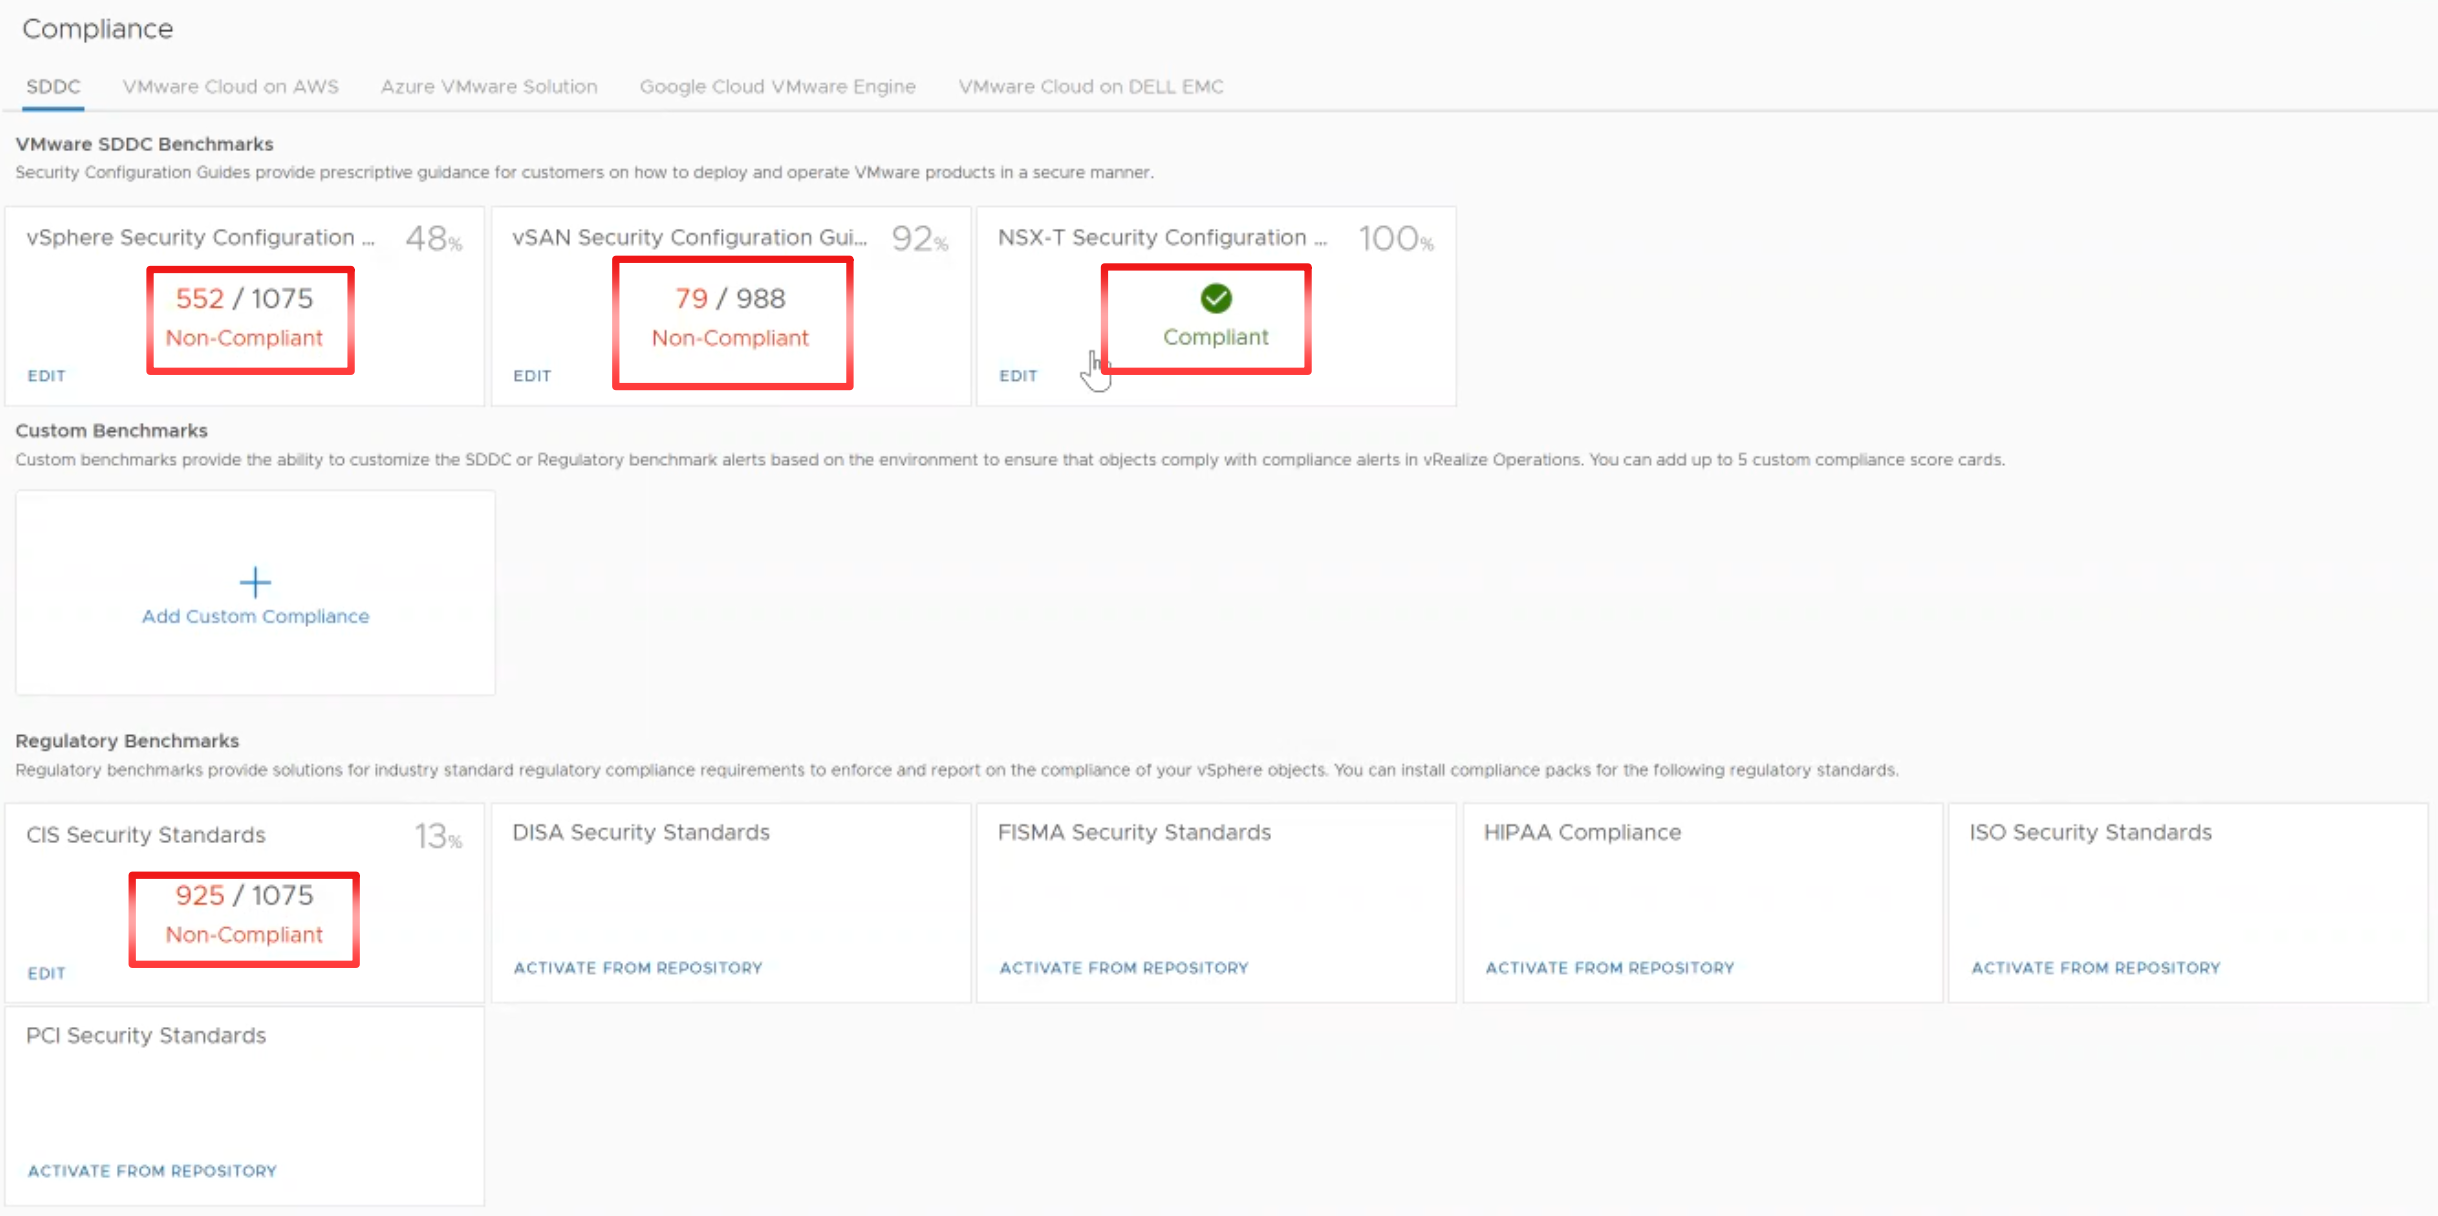
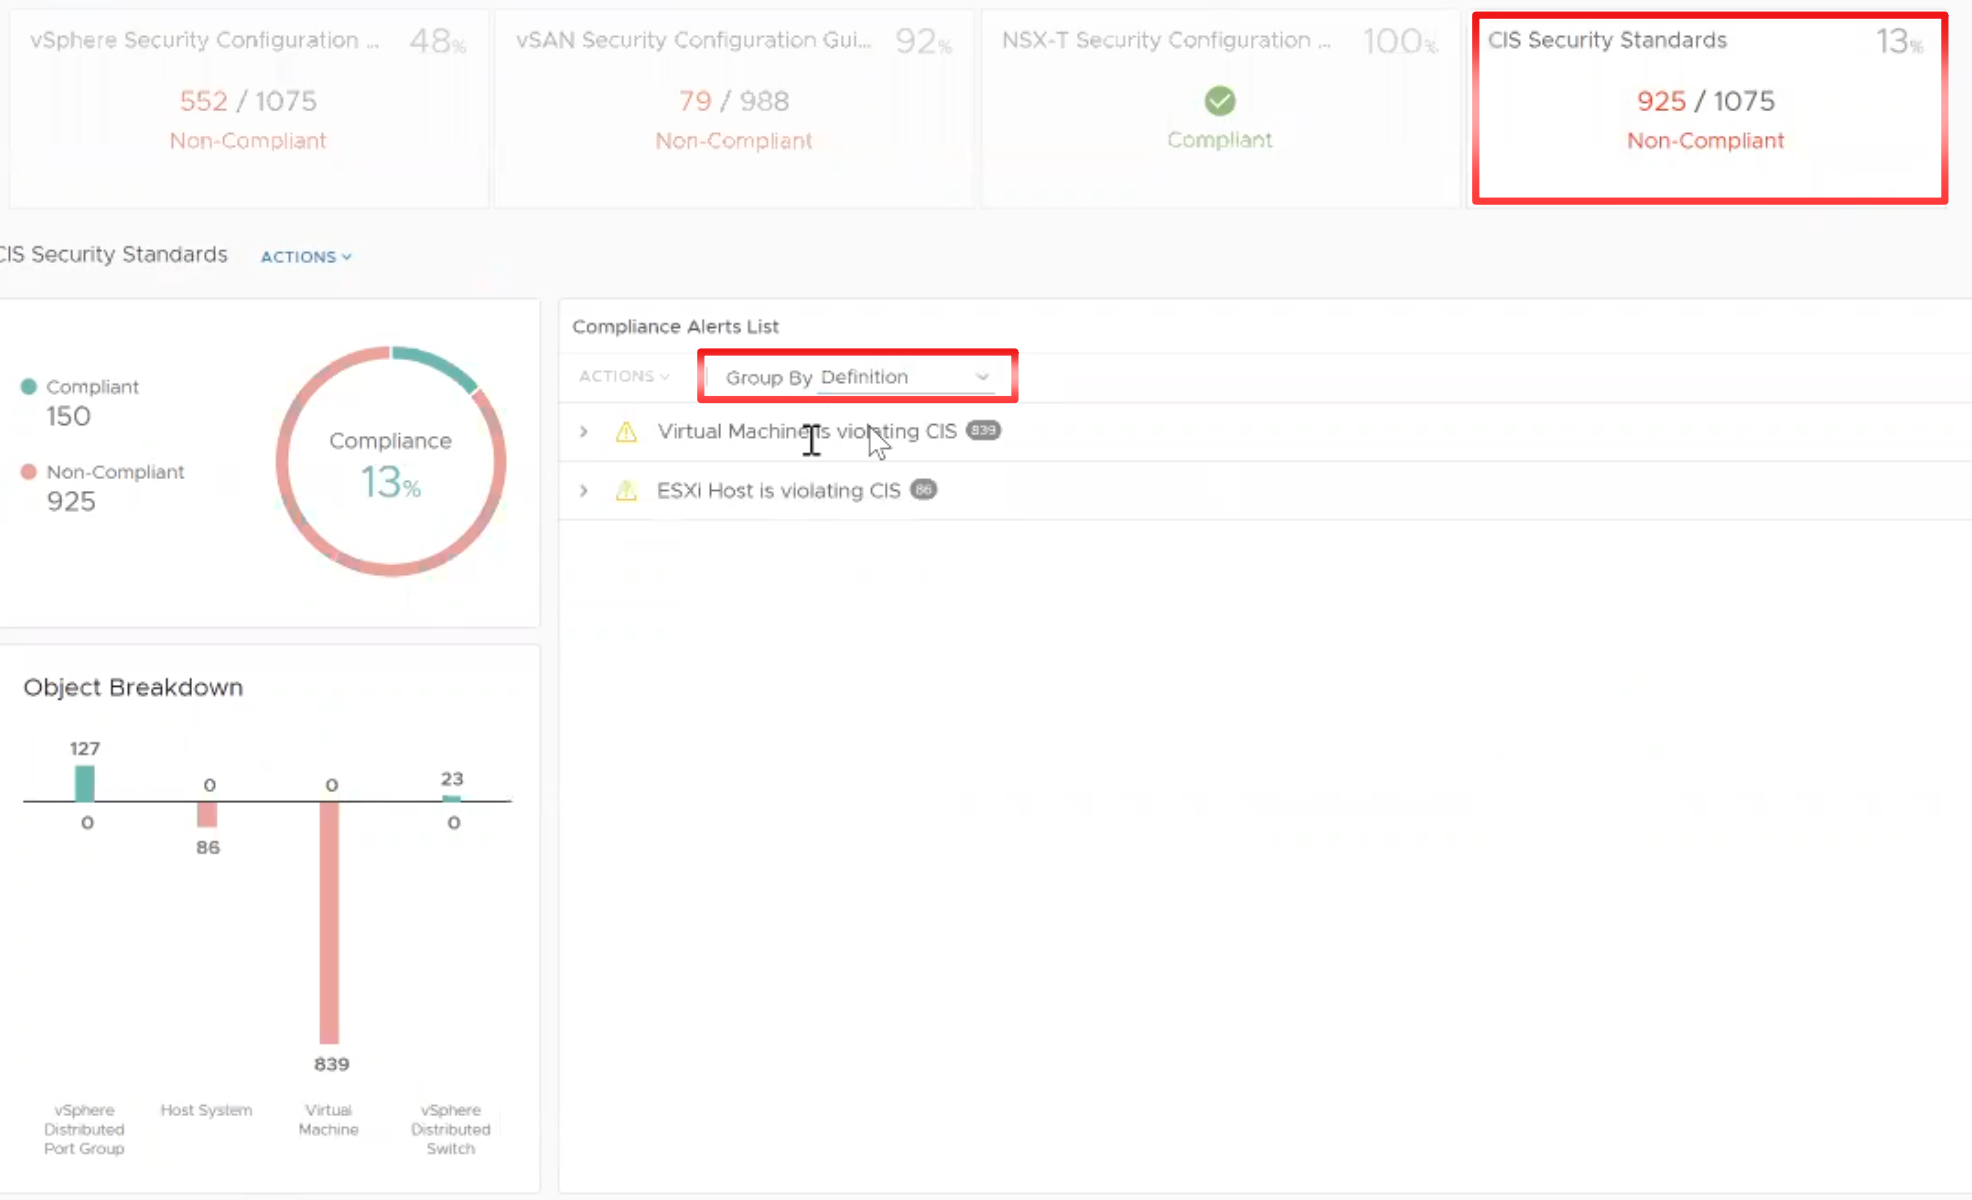
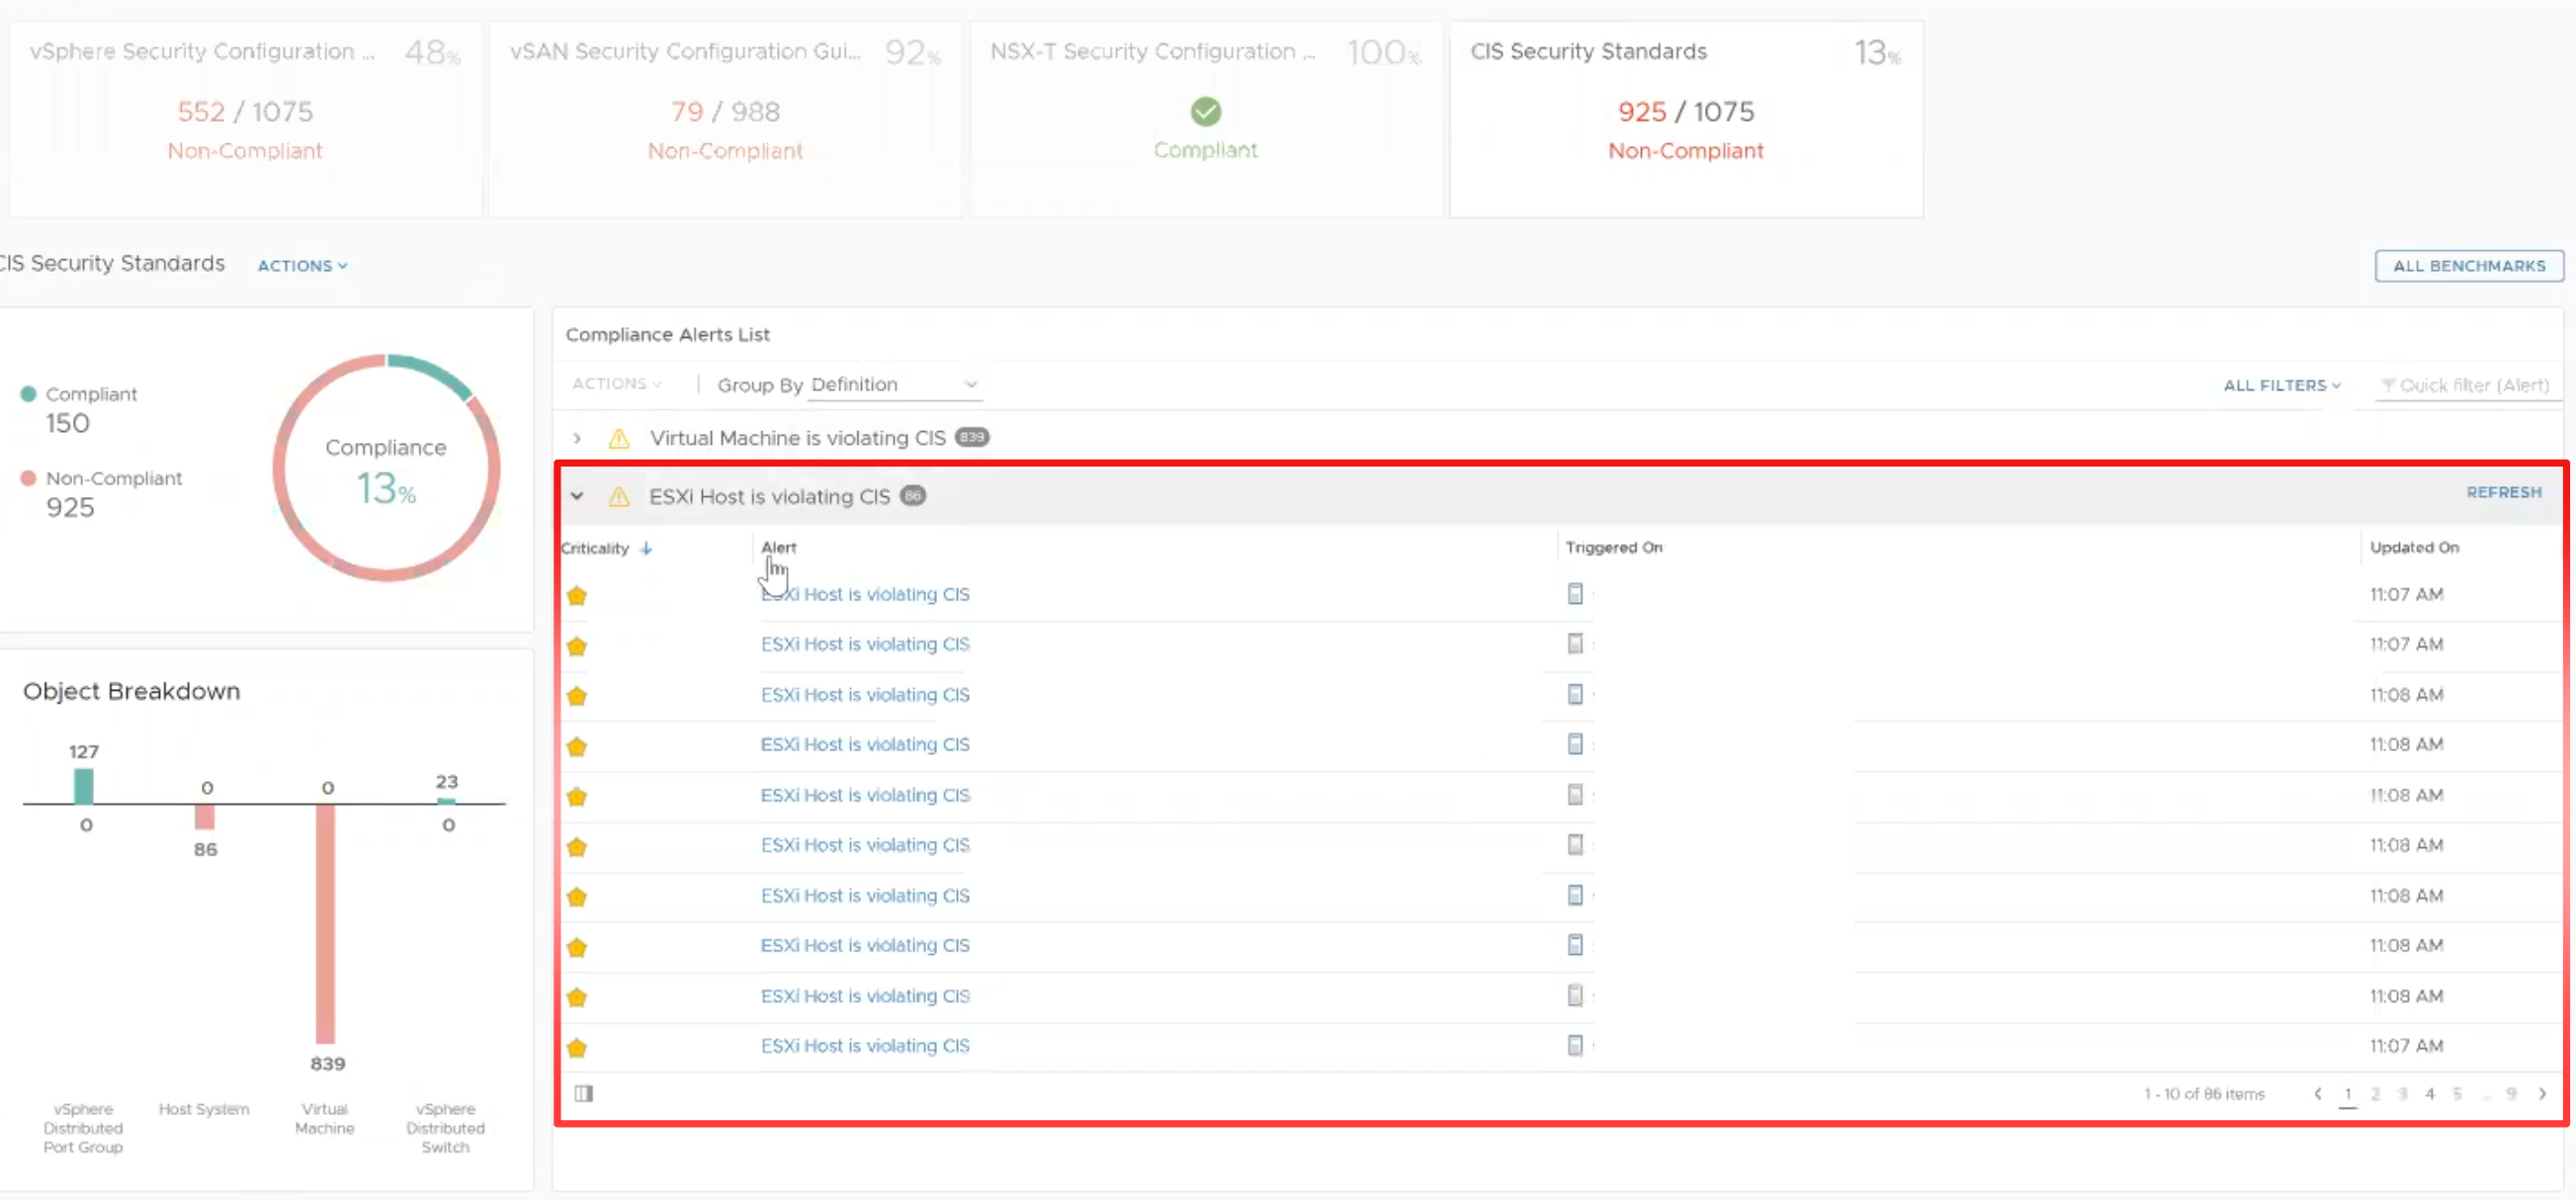
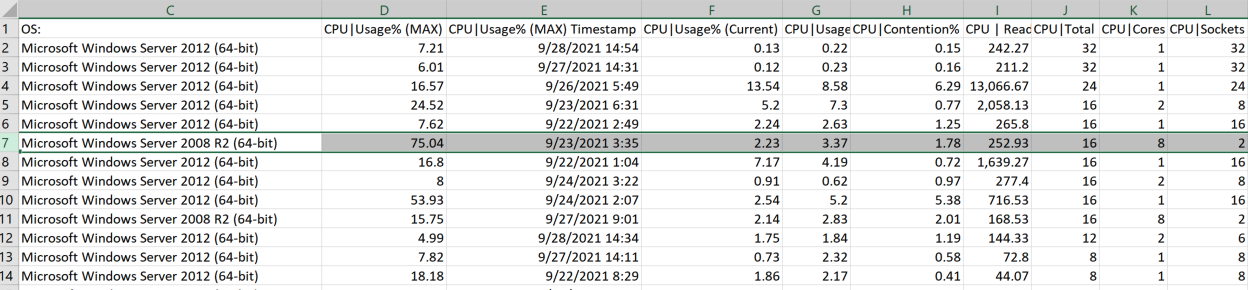
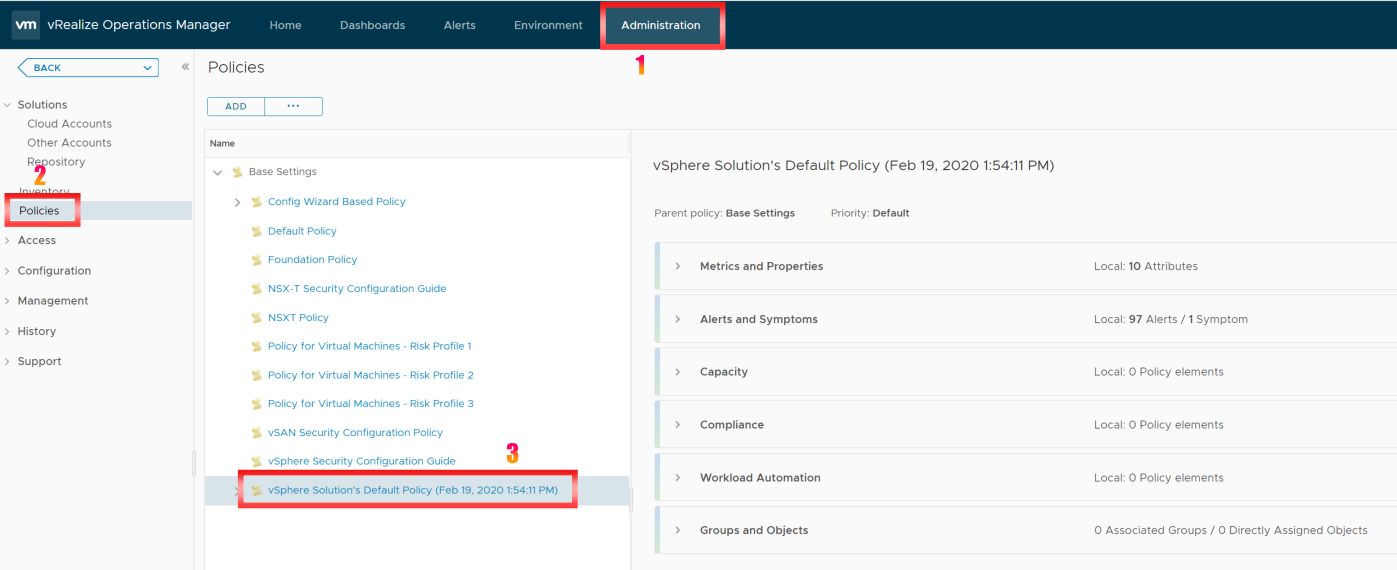
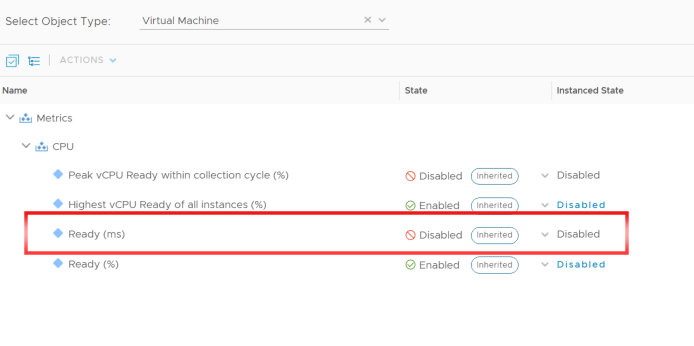
In Aria Operation 8.18, you may monitor vCenter Server services by going to the vCenter Appliance Availability dashboard.
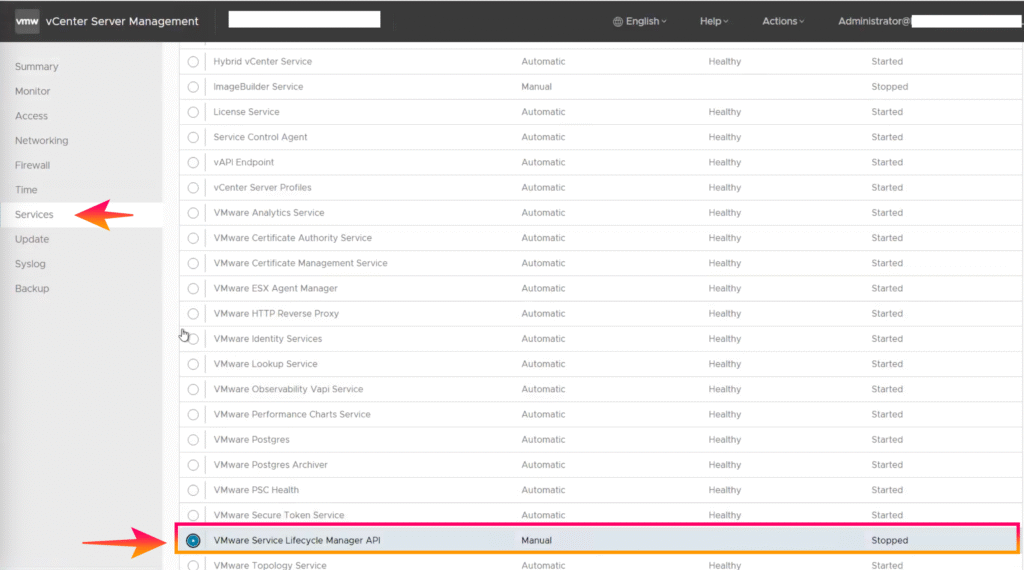
If you do not see vCenter and all its services, please check the VMware Service Lifecycle Manager API in the vCenter Appliance and start these services. (In vCenter Server Management versions 8.0.3 and above, the start type must be set to automated).
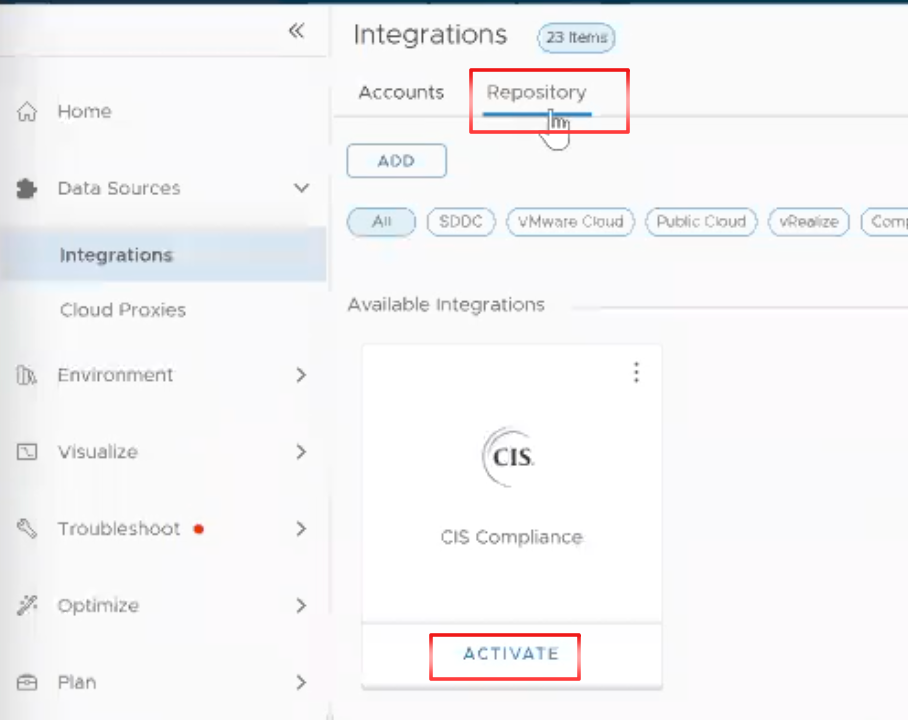
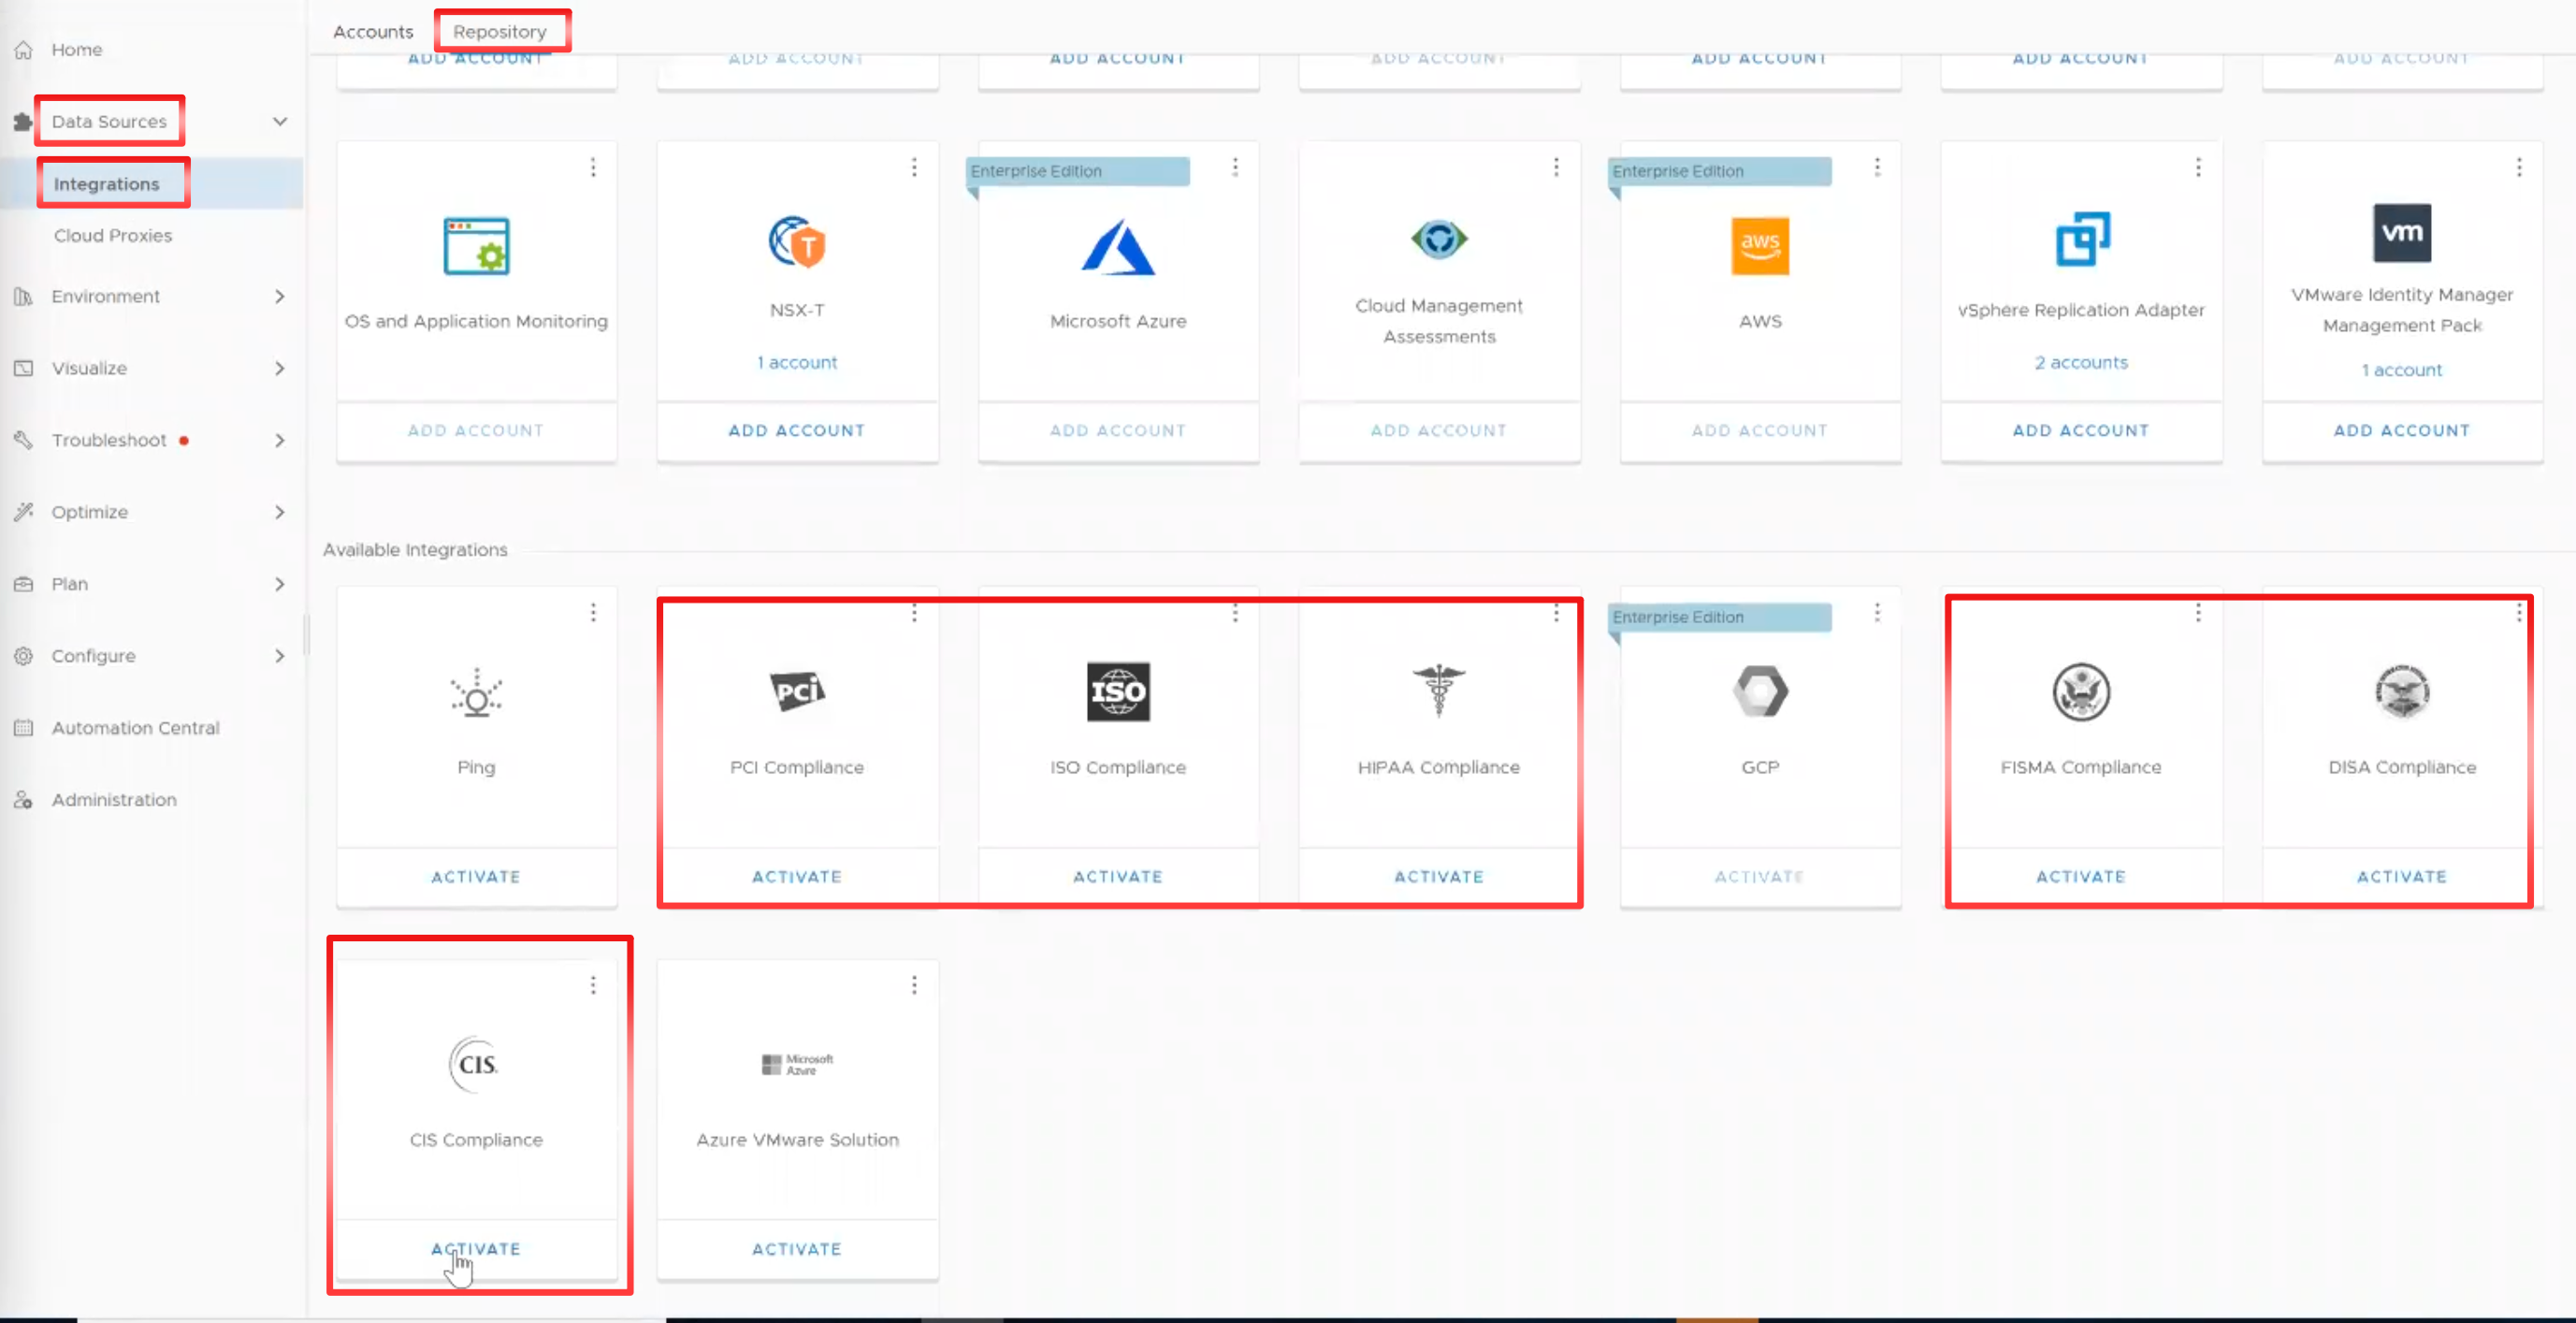
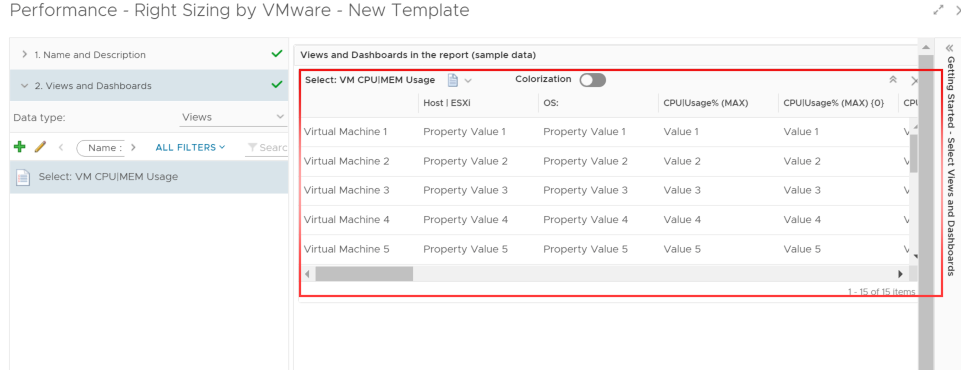
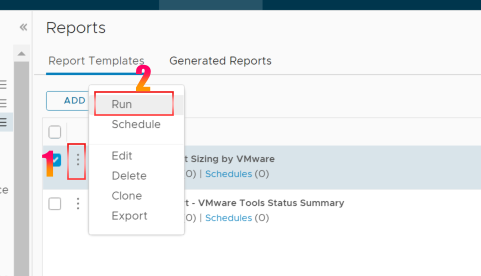
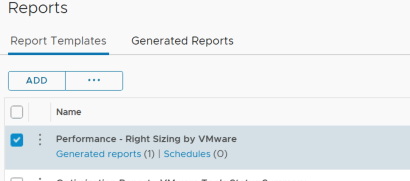
Step-by-Step
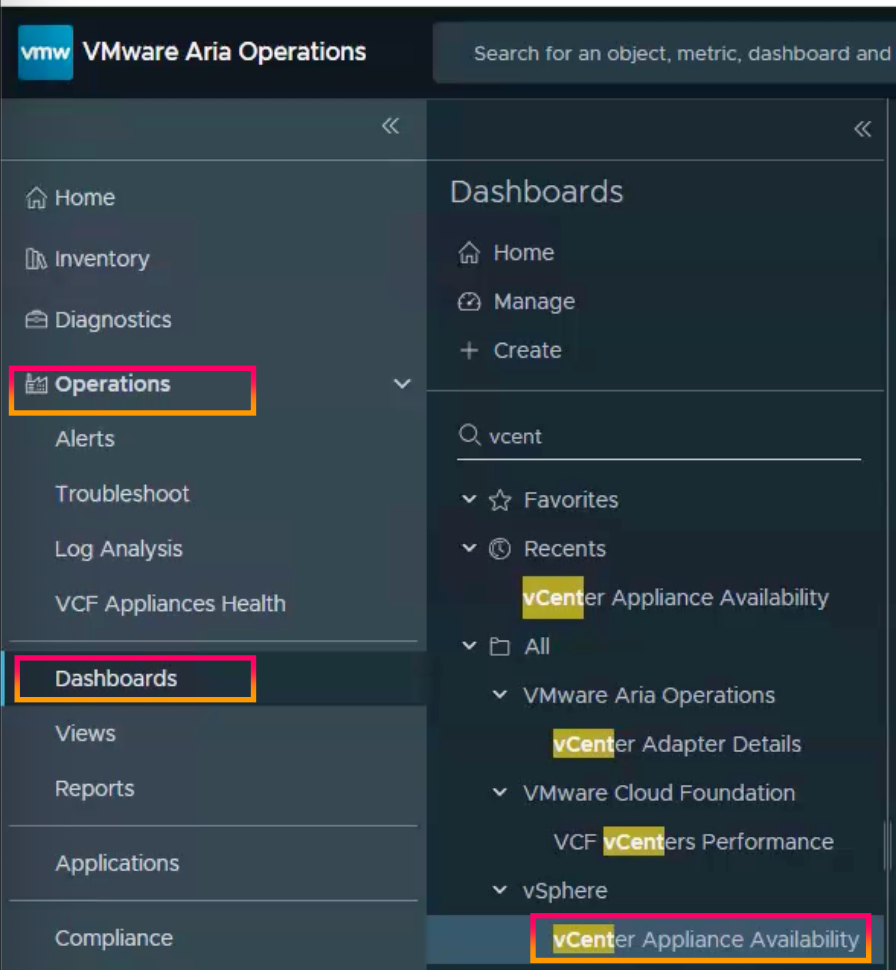
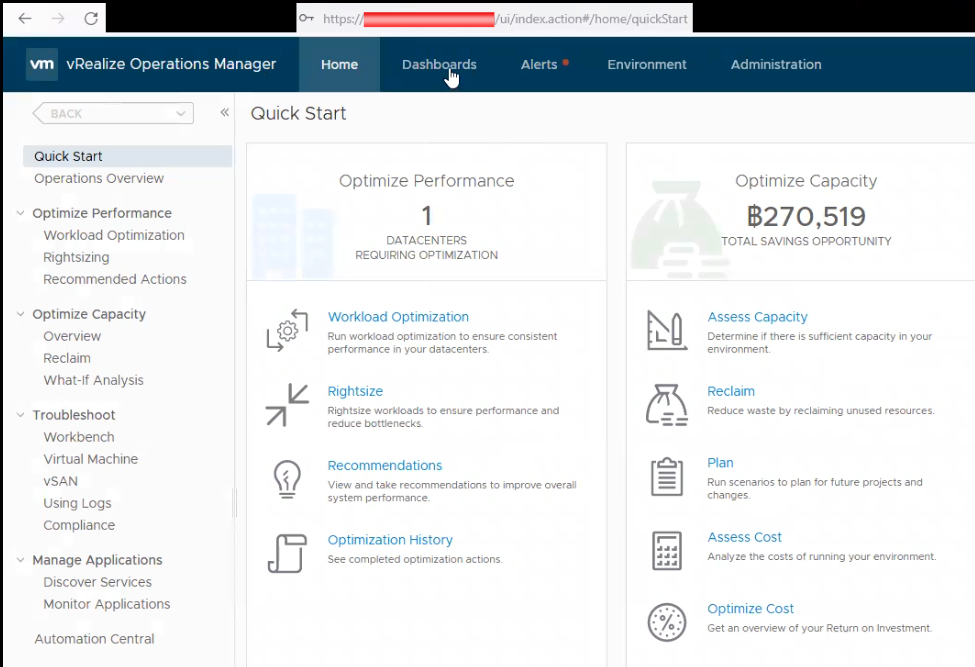
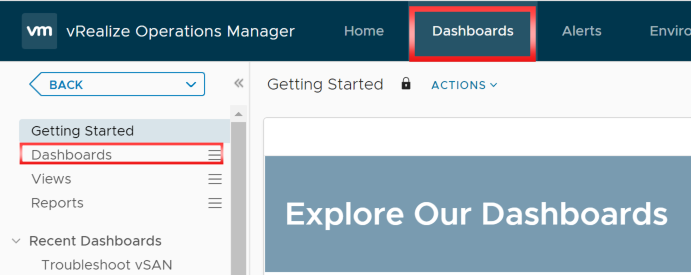
1.Log in to Aria Operations and go to “Operations” then “Dashboards” to find the “vCenter Appliance Availability” Dashboard.
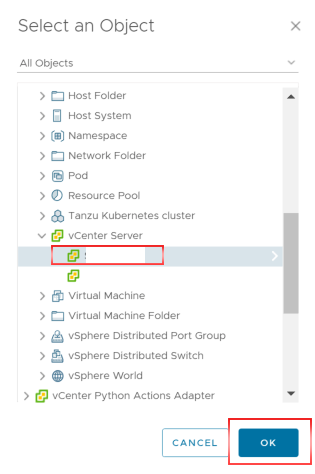
2.when you click on the vCenter Server. The entire vCenter Server is not visible, and you receive the message “The view cannot be rendered for the specified Object“.
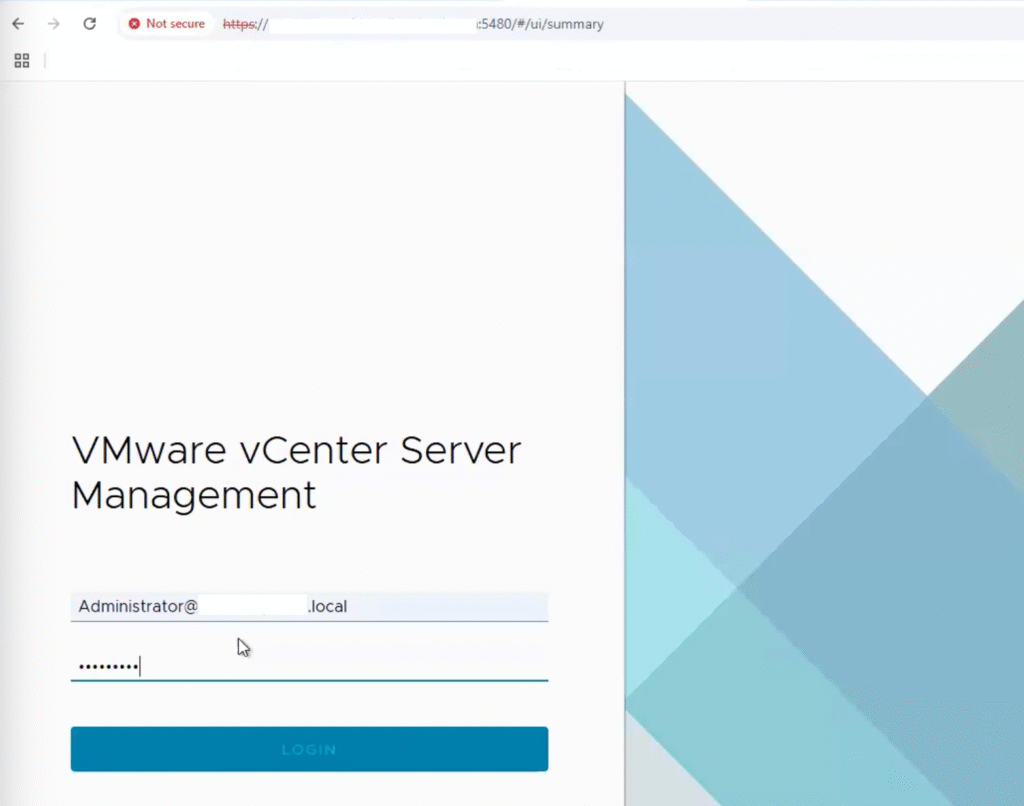
3.Login to the vCenter server Appliance
4.In a Web browser, go to the vCenter Server Appliance Management Interface, https://appliance-IP-address-or-FQDN:5480.
5.You have to start the “VMware Service Lifecycle Manager API” from the vCenter Appliance. (Automated start needs to be performed in vCenter Server Management versions 8.0.3 and above).
6.Navigate to “Services” and select “VMware Service Lifecycle Manager API“.
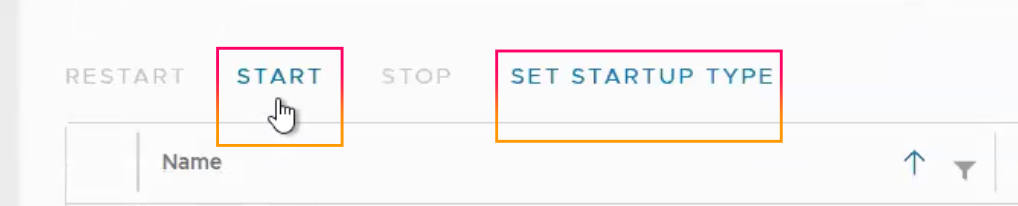
7.Click “START” and select “SET STARTUP TYPE“.
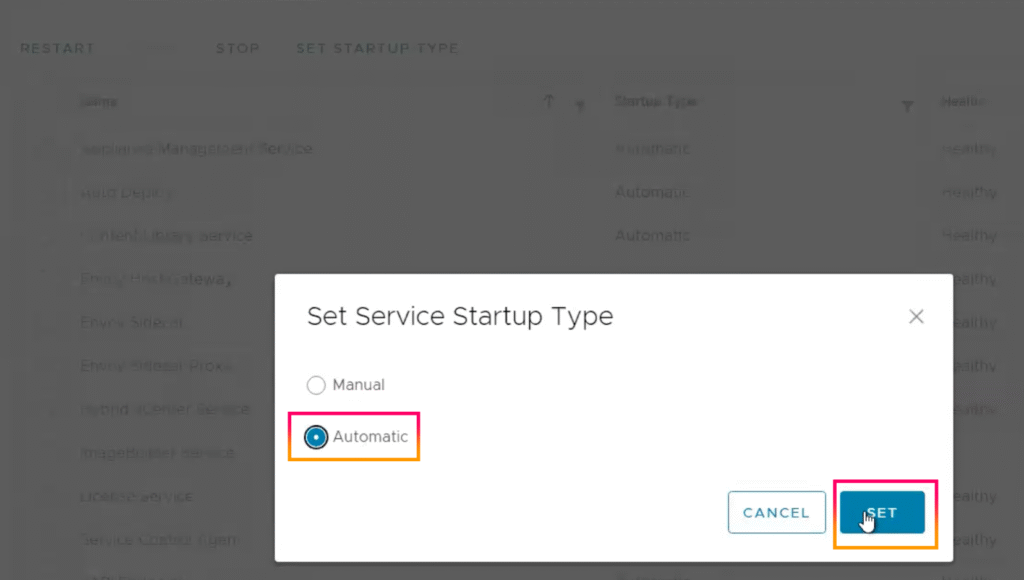
8.Set Service Startup Type to “Automatic” and click “SET“.
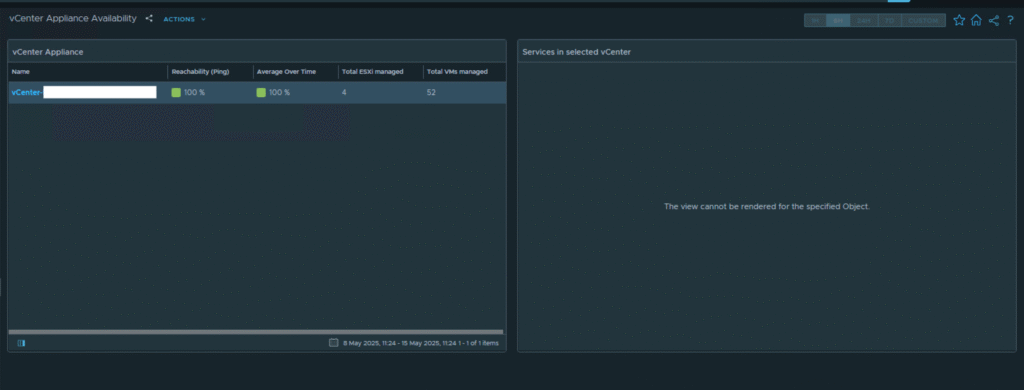
9.Wait 5 to 10 minutes before logging back into Aria Operations and selecting the “vCenter Appliance Availability” dashboard. Select “vCenter Server“, and the vCenter Server services will appear.
VMware has announced the official renaming of all products in our cloud management family to VMware Aria.
What is VMware Aria?
A unified management solution for cloud native applications and multi-cloud.
VMware Aria, a multi-cloud management portfolio that provides a set of end-to-end solutions for managing the cost, performance, configuration, and delivery of infrastructure and applications. Expressly designed for the operational challenges of cloud-native applications and public cloud environments, VMware Aria truly delivers a wholly new perspective on multi-cloud management.
The VMware Aria Product List
Previous Name
New Name
Automation
vRealize Automation / Cloud
VMware Aria Automation
VMware Cloud Assembly
VMware Aria Automation Assembler
VMware Service Broker
VMware Aria Automation Service Broker
VMware Code Stream
VMware Aria Automation Pipelines
VMware Cloud Templates
VMware Aria Automation Templates
vRealize Orchestrator
VMware Aria Automation Orchestrator
vRealize Automation SaltStack Config
VMware Aria Automation Config
vRealize Automation SaltStack SecOps
VMware Aria Automation for Secure Hosts
CloudHealth Secure State
VMware Aria Automation for Secure Clouds
Operations
vRealize Operations / Cloud
VMware Aria Operations
vRealize Log Insight / Cloud
VMware Aria Operations for Logs
vRealize Network Insight / Cloud
VMware Aria Operations for Networks
Tanzu Observability by Wavefront
VMware Aria Operations for Applications
vRealize True Visibility Suite
VMware Aria Operations for Integrations
Cost
CloudHealth
VMware Aria Cost powered by CloudHealth
Suites
vRealize Cloud Universal
VMware Aria Universal Suite
vRealize Suite
VMware Aria Suite
vCloud Suite
VMware vCloud Suite
CloudHealth by VMware Suite
Discontinued Name
CloudHealth Partner Platform
Discontinued Name – see Aria Cost powered by CloudHealth
Platform & Cross-Cloud Services
Project Ensemble
VMware Aria Hub
New
VMware Aria Graph
vRealize Migration Manager
VMware Aria Migration
vRealize Automation Cloud Guardrails
VMware Aria Guardrails
Project Ensemble Insights
VMware Aria Business Insights
Other
Skyline
VMware Skyline
vRealize Suite Lifecycle Manager
VMware Aria Suite Lifecycle
vRealize Cloud Subscription Manager
VMware Aria Hub Subscription
vRealize AI Cloud
Discontinued Name – functionality now part of Aria Hub
Reference:
Please see the links listed below for further information about VMware Aria and the portfolio products.
VMware issued a security alert for VMware vRealize Operations (vROps) due to the VMSA-2022-0034 severity. According to the advisory, VMware vRealize Operations (vROps) updates address privilege escalation vulnerabilities (CVE-2022-31707, CVE-2022-31708).
Solution
To remediate CVE-2022-31707 apply the fixes listed in the ‘Fixed Version’ column of the ‘Response Matrix’ below.
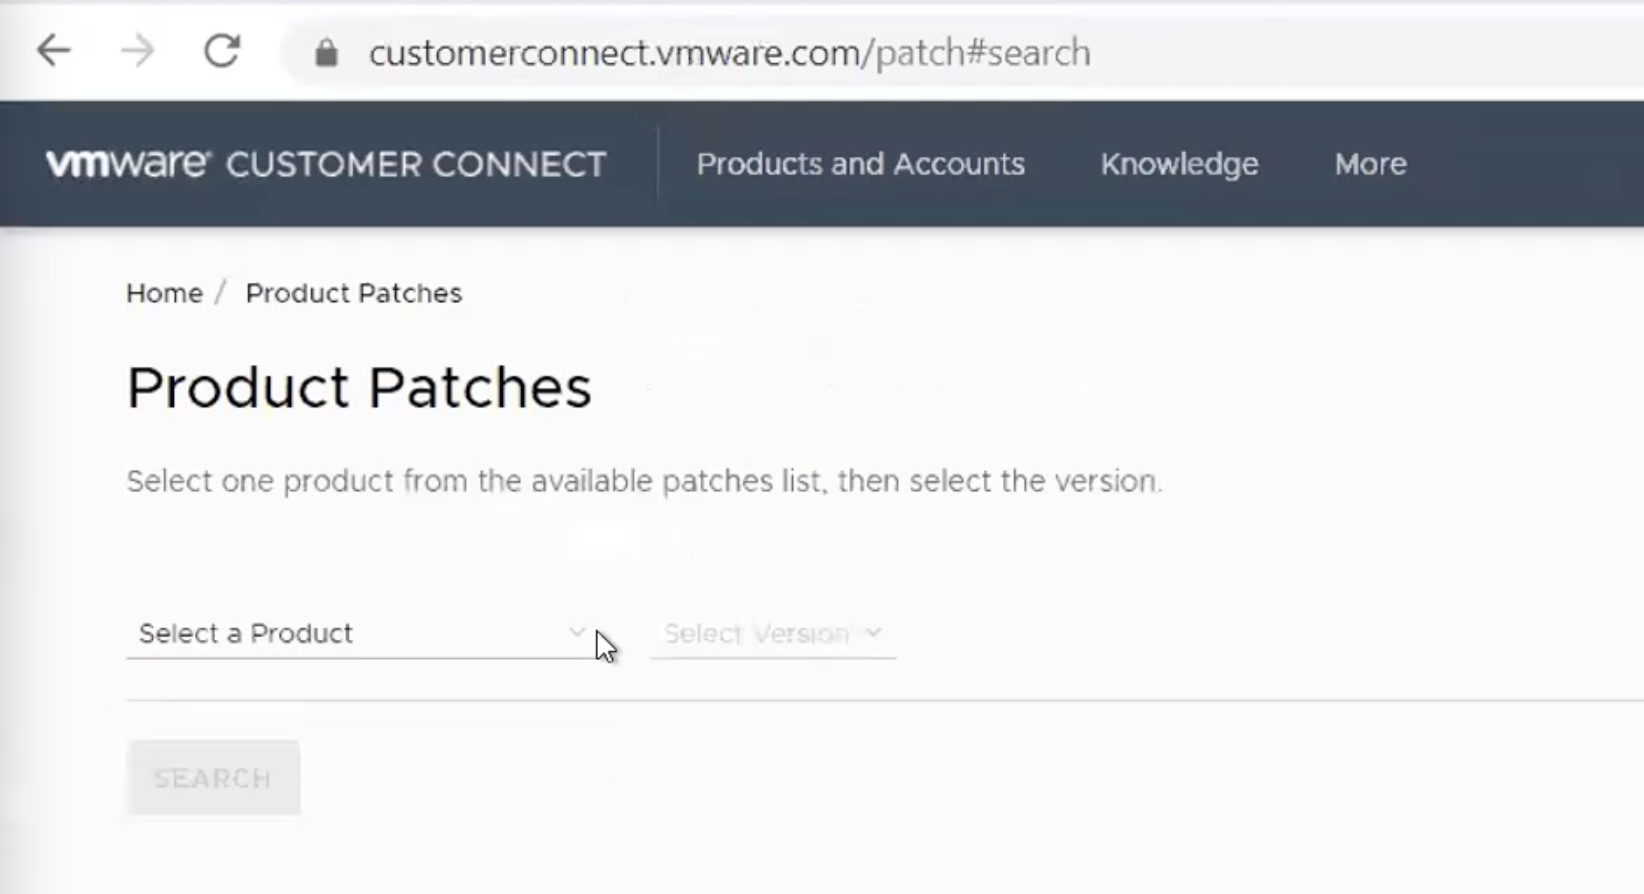
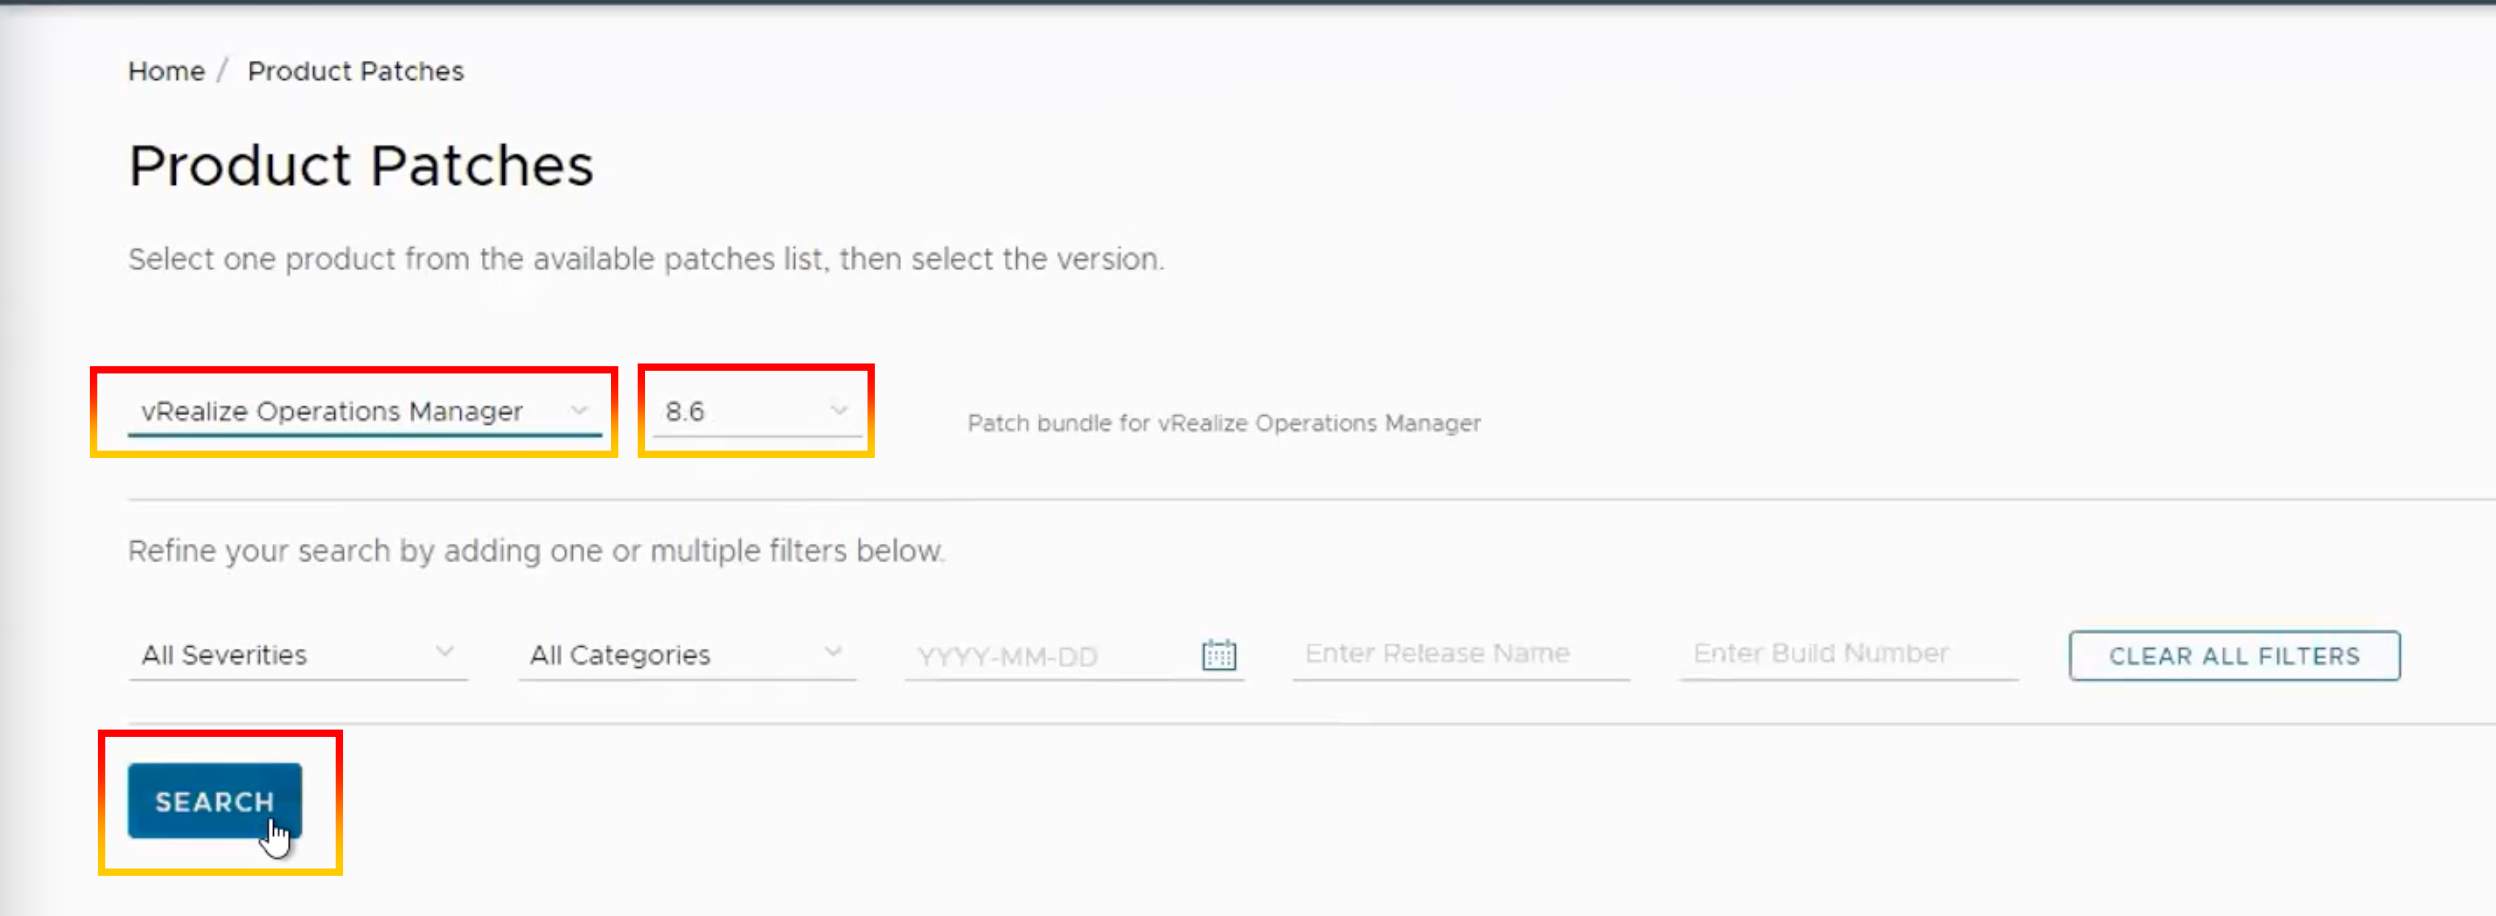
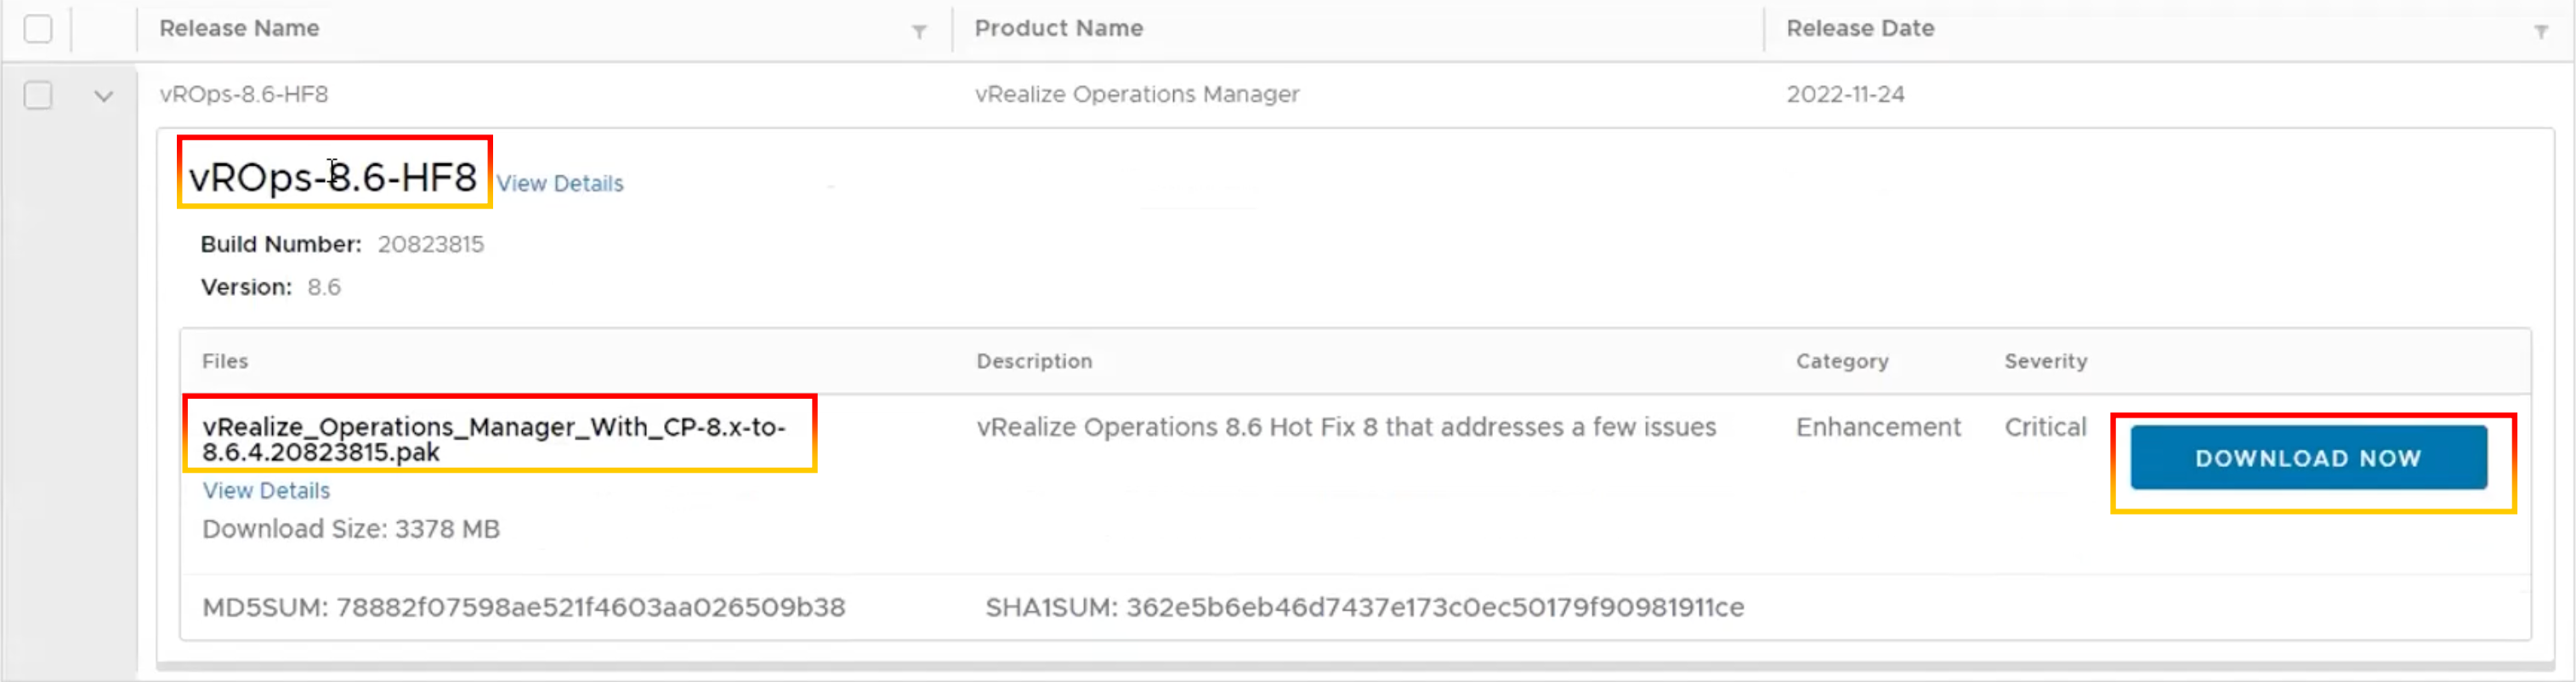
4.Choose the product and version, then press the “Search” button.
Product: vRealize Operations Manager Version: 8.6
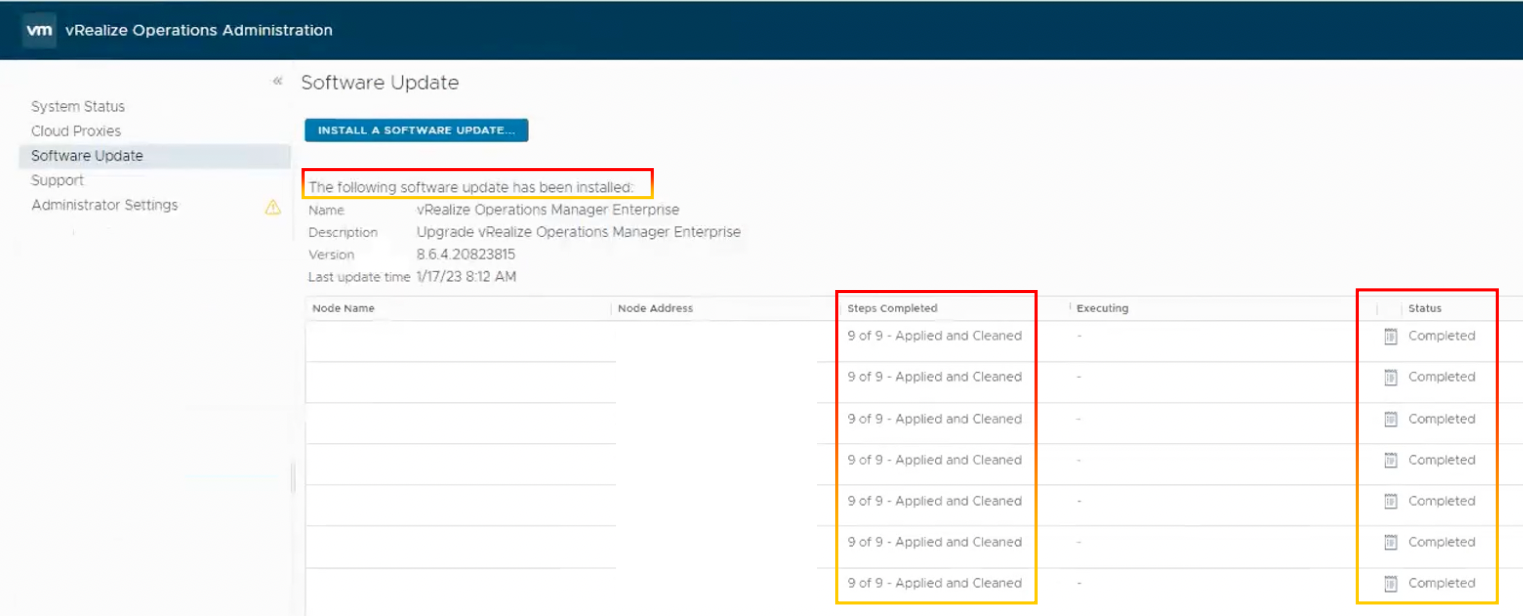
5.The “vROps-8.6-HF8” will be shown. Verify and validate the KB90232 patch file, then click “DOWNLOAD NOW.”.
6.Once the file download and snapshot have been completed, Log in to the vRealize Operations Manager administration interface
https://master-node-name-or-ip-address/admin.
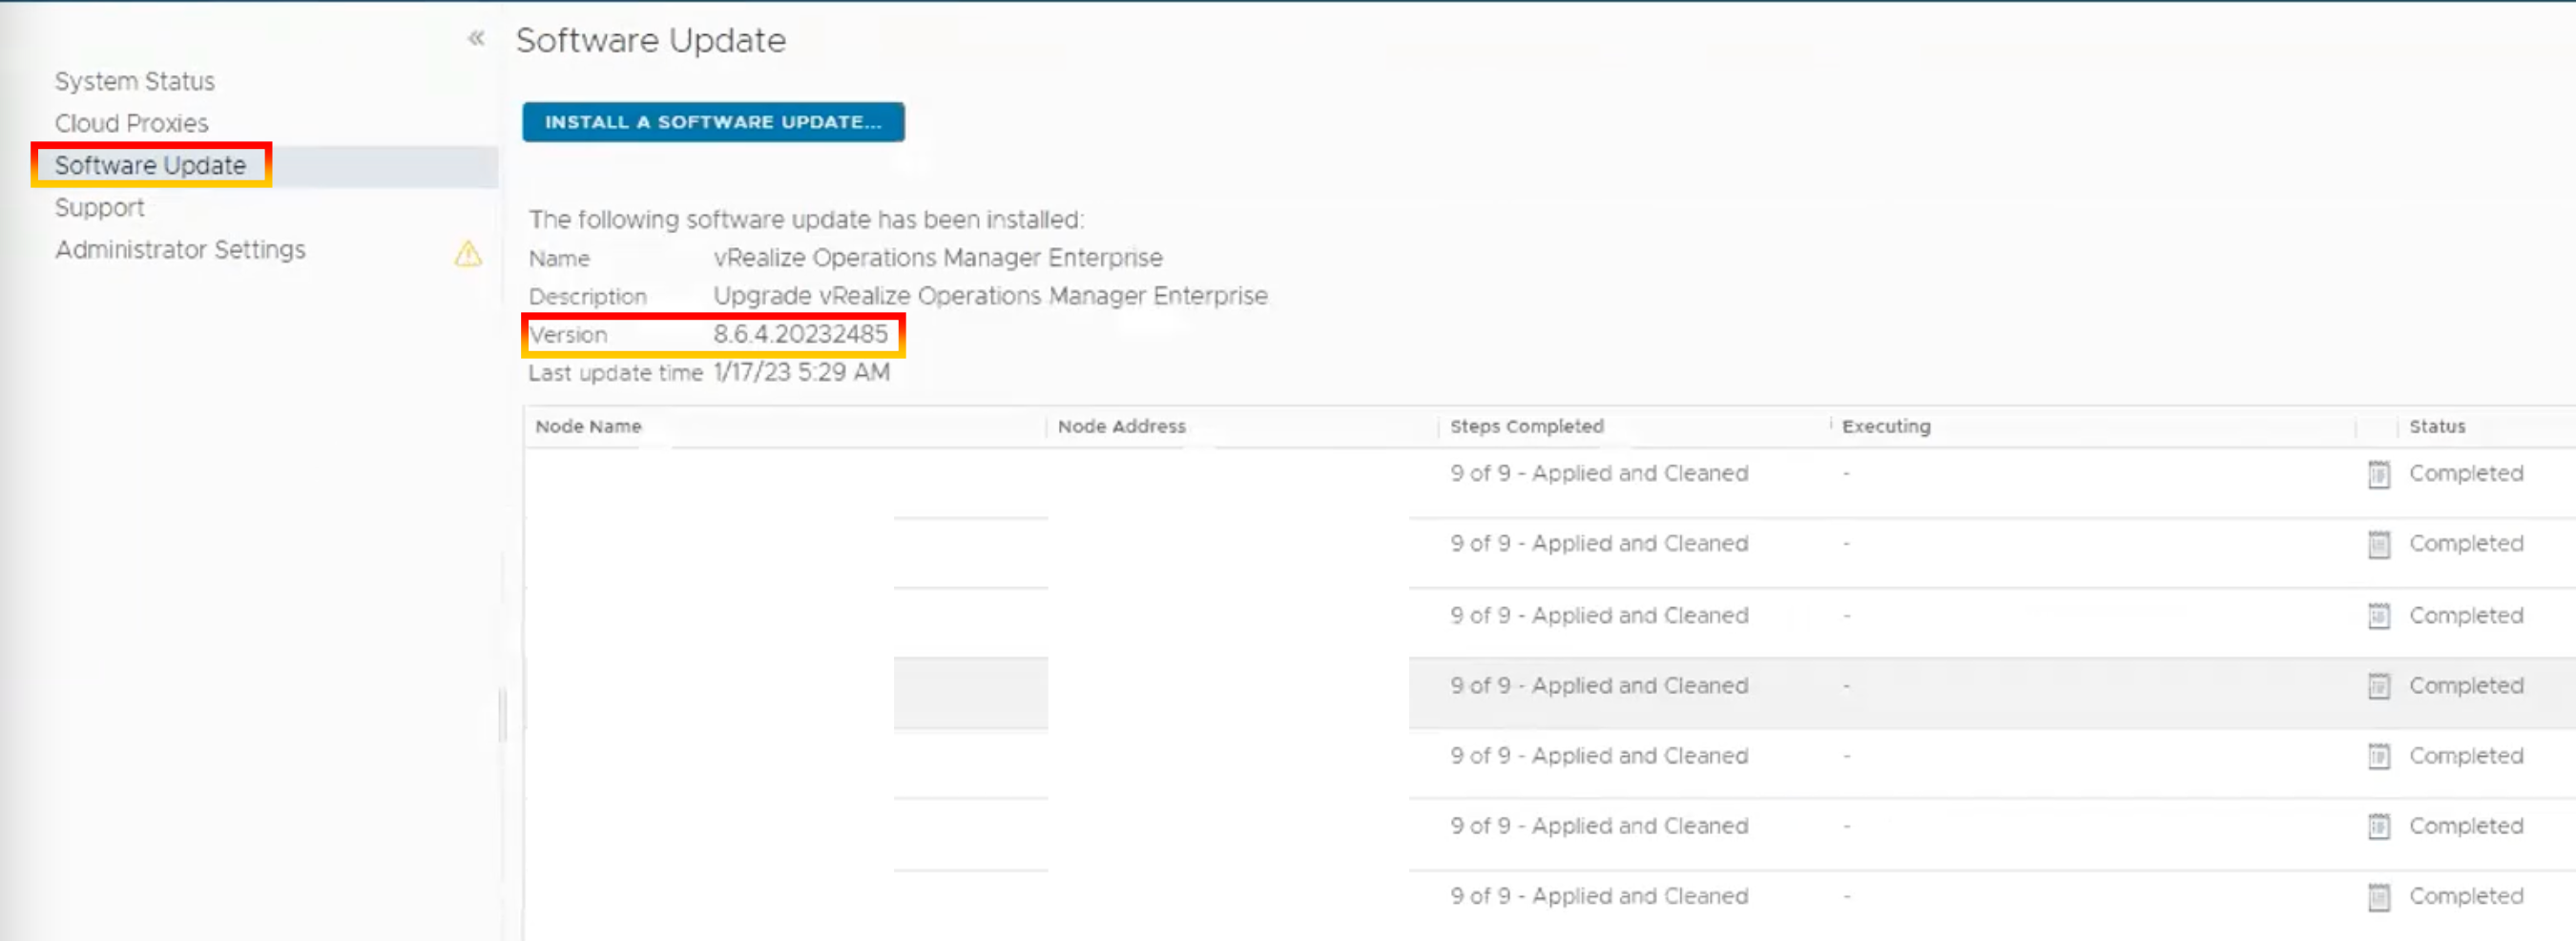
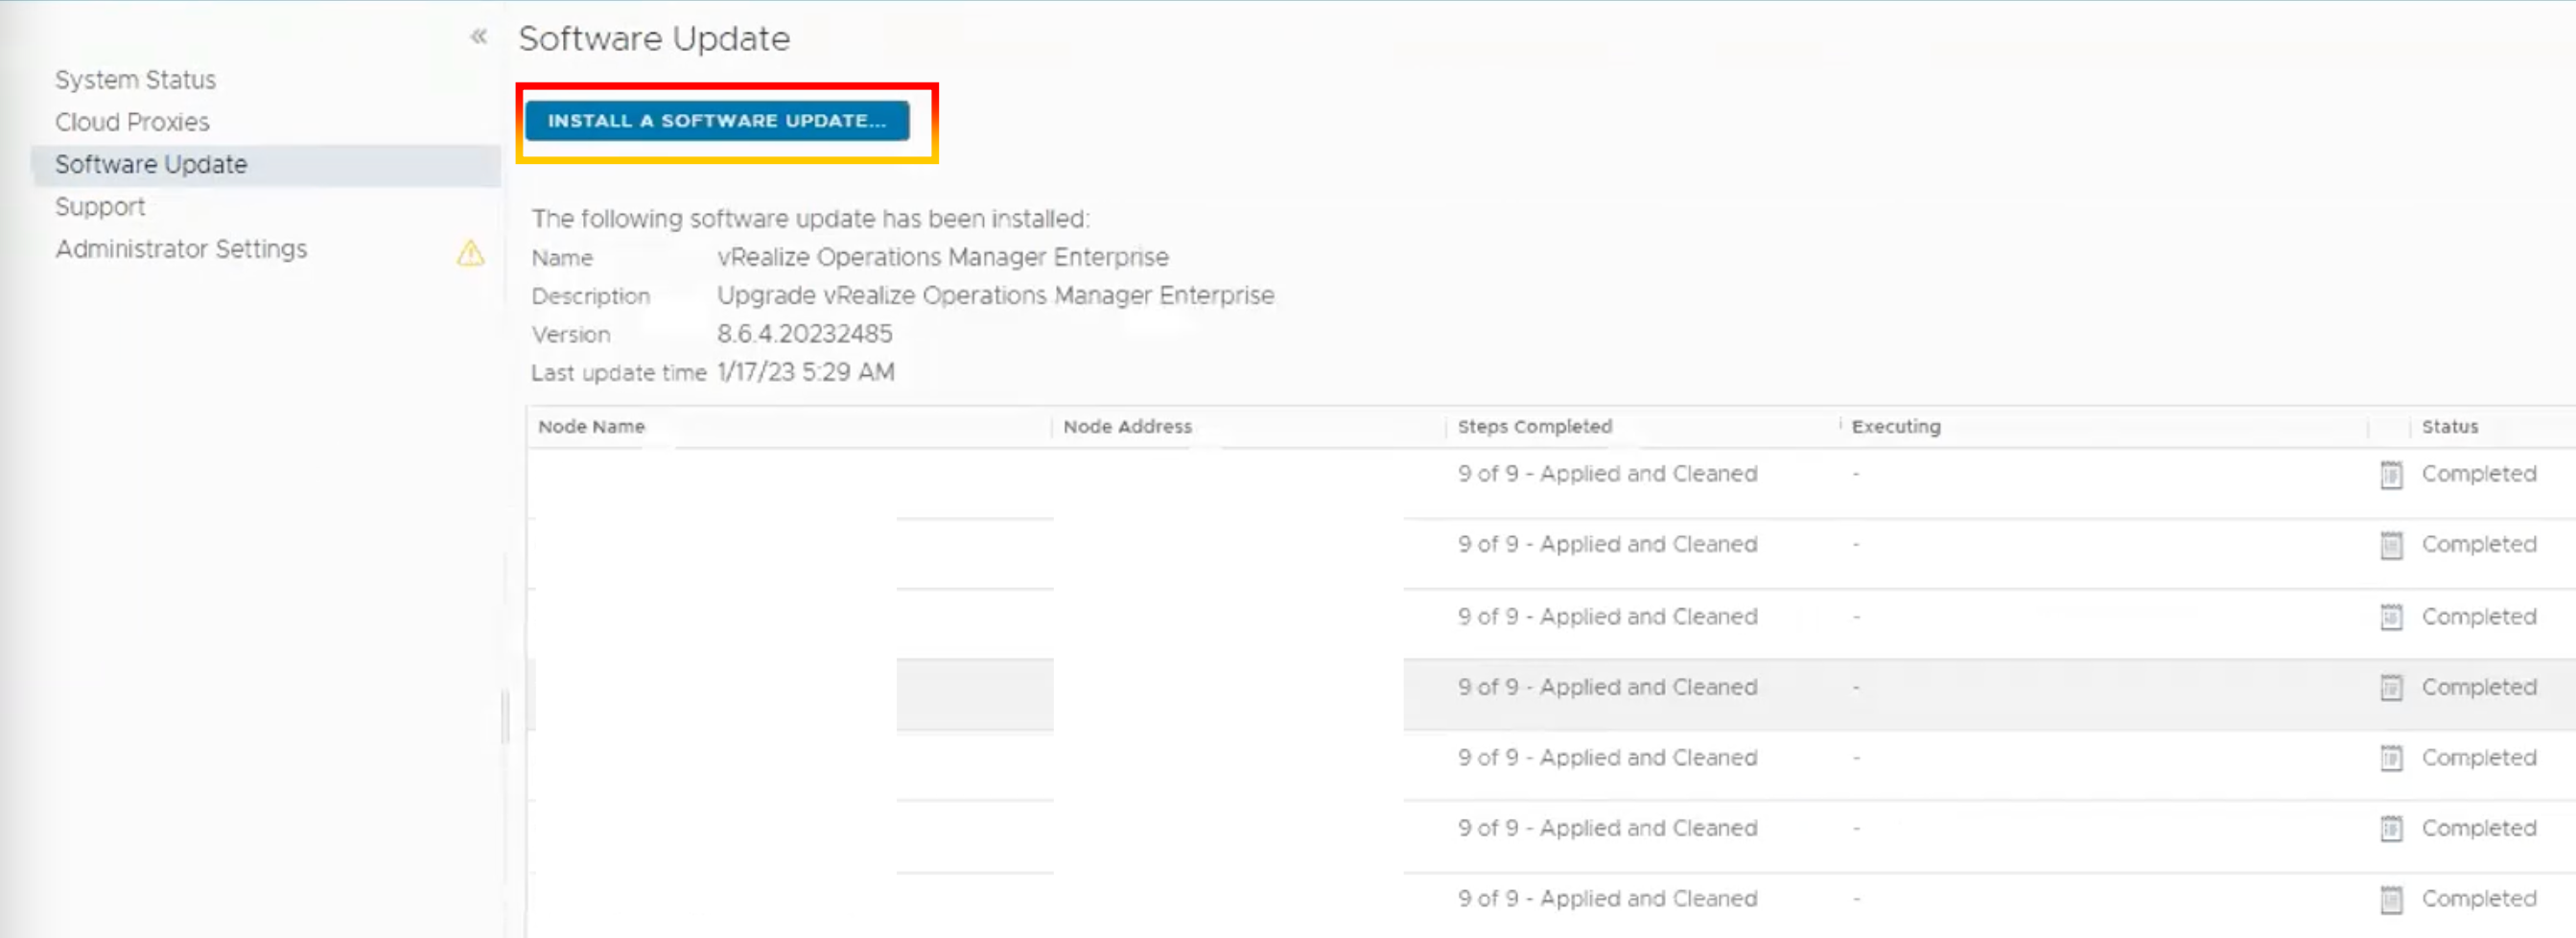
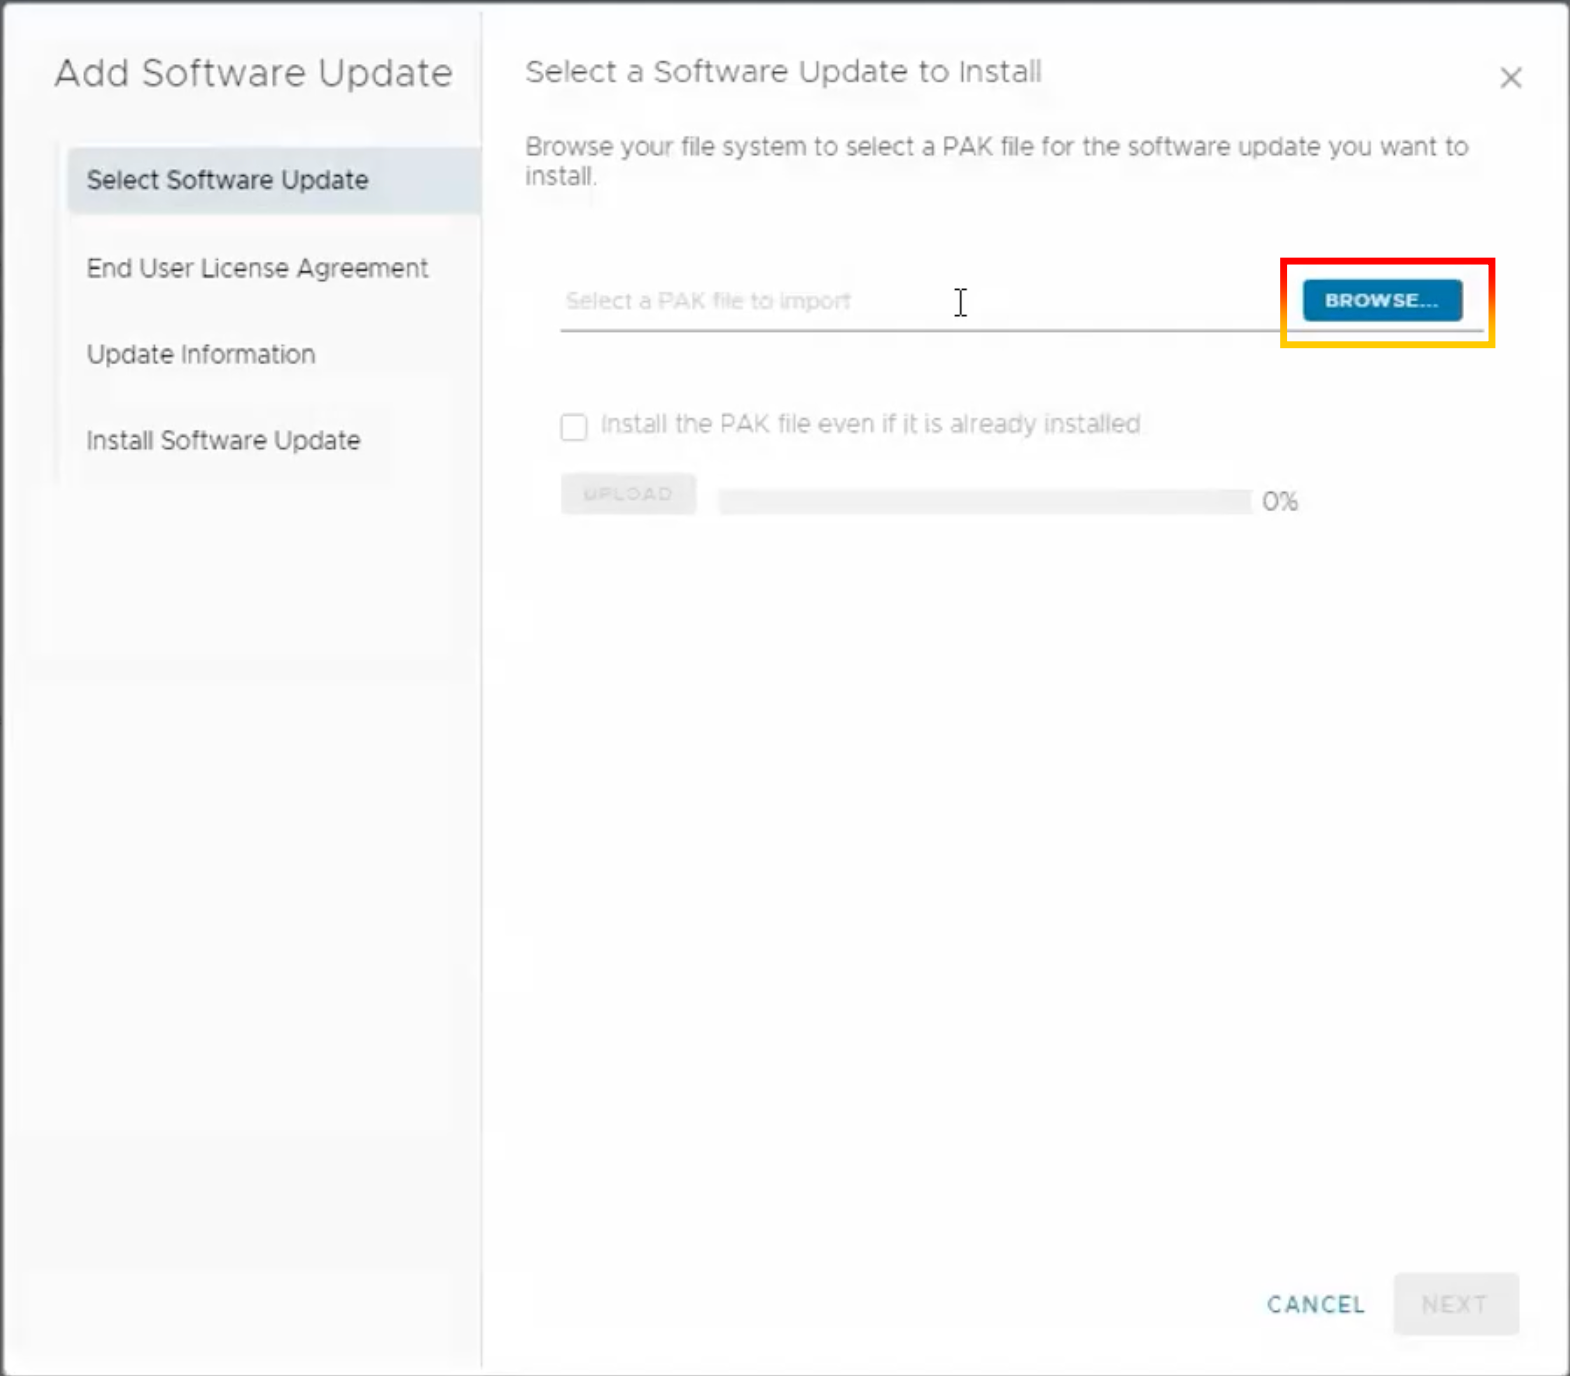
7.Click “Software Update“.
8.Click “Install a Software Update“.
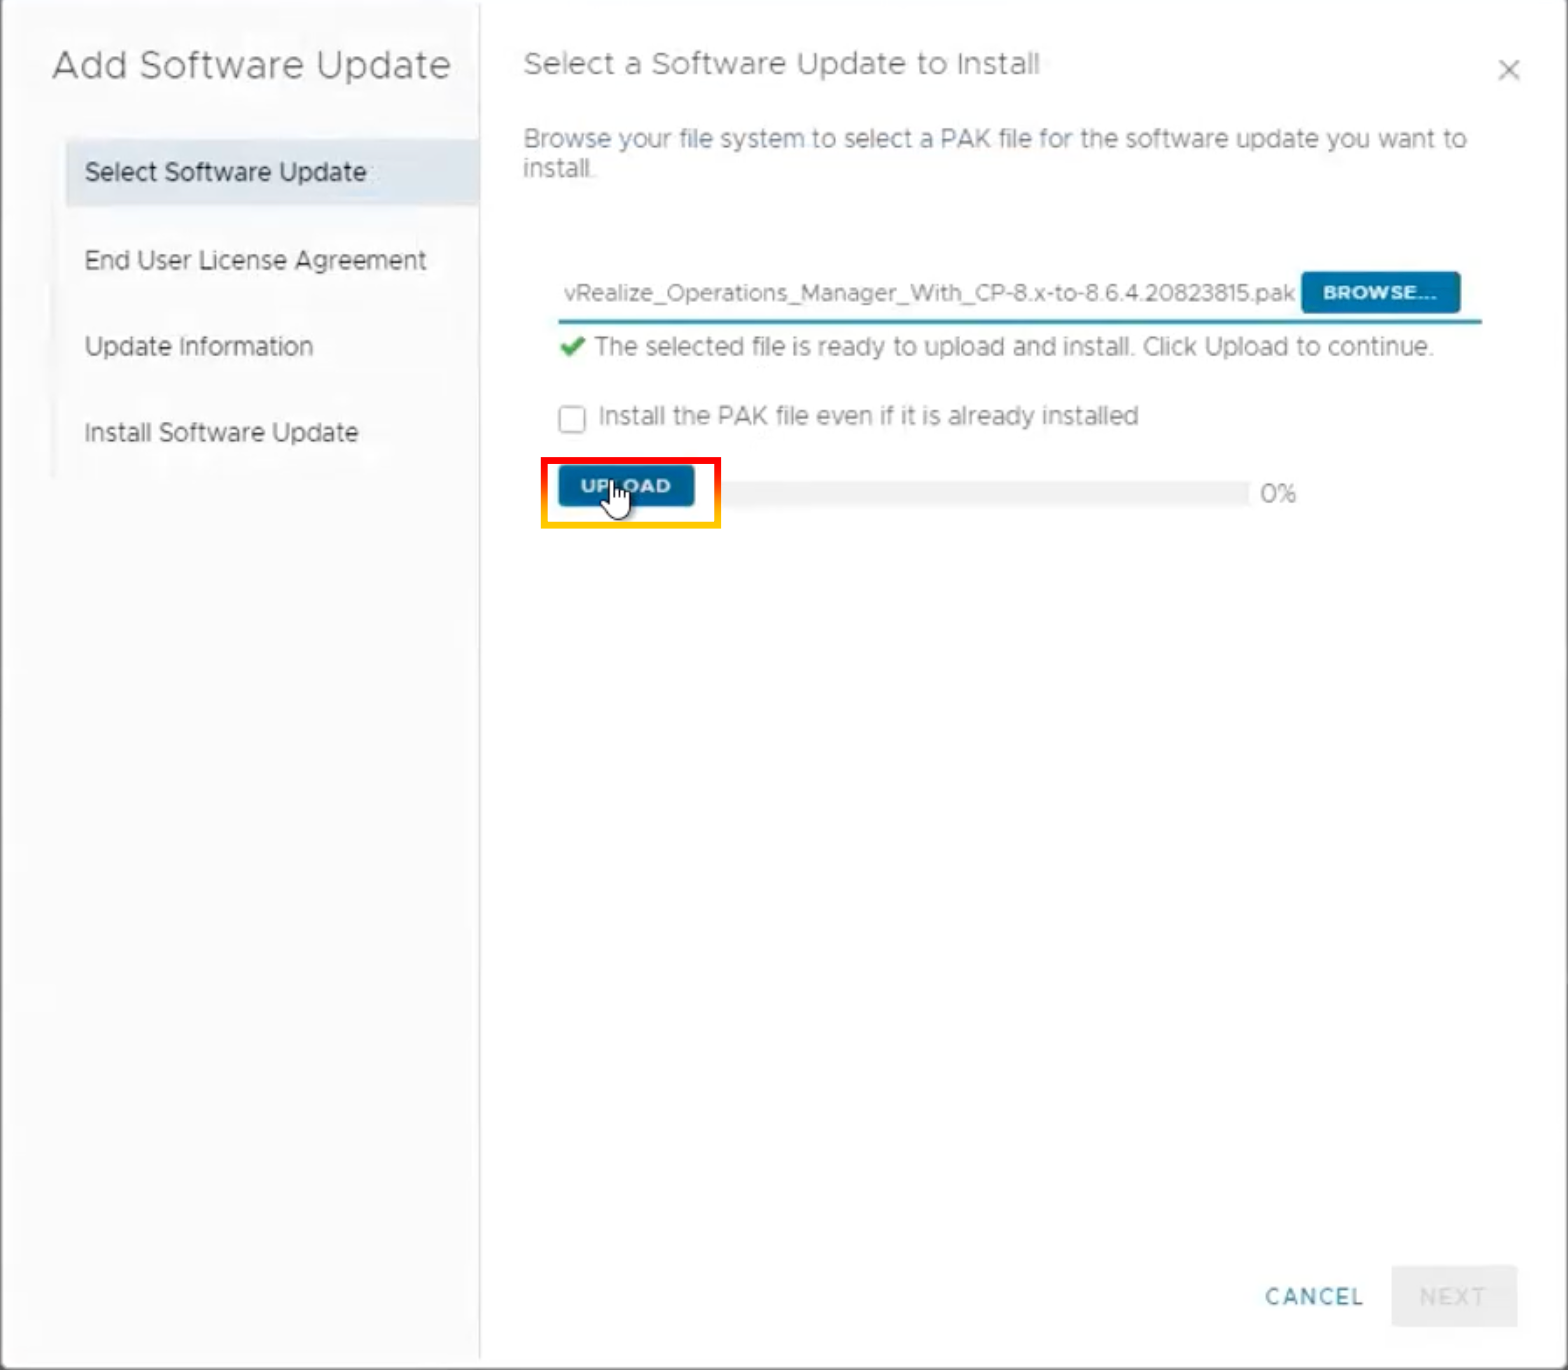
9.Go through the pack file you already downloaded.
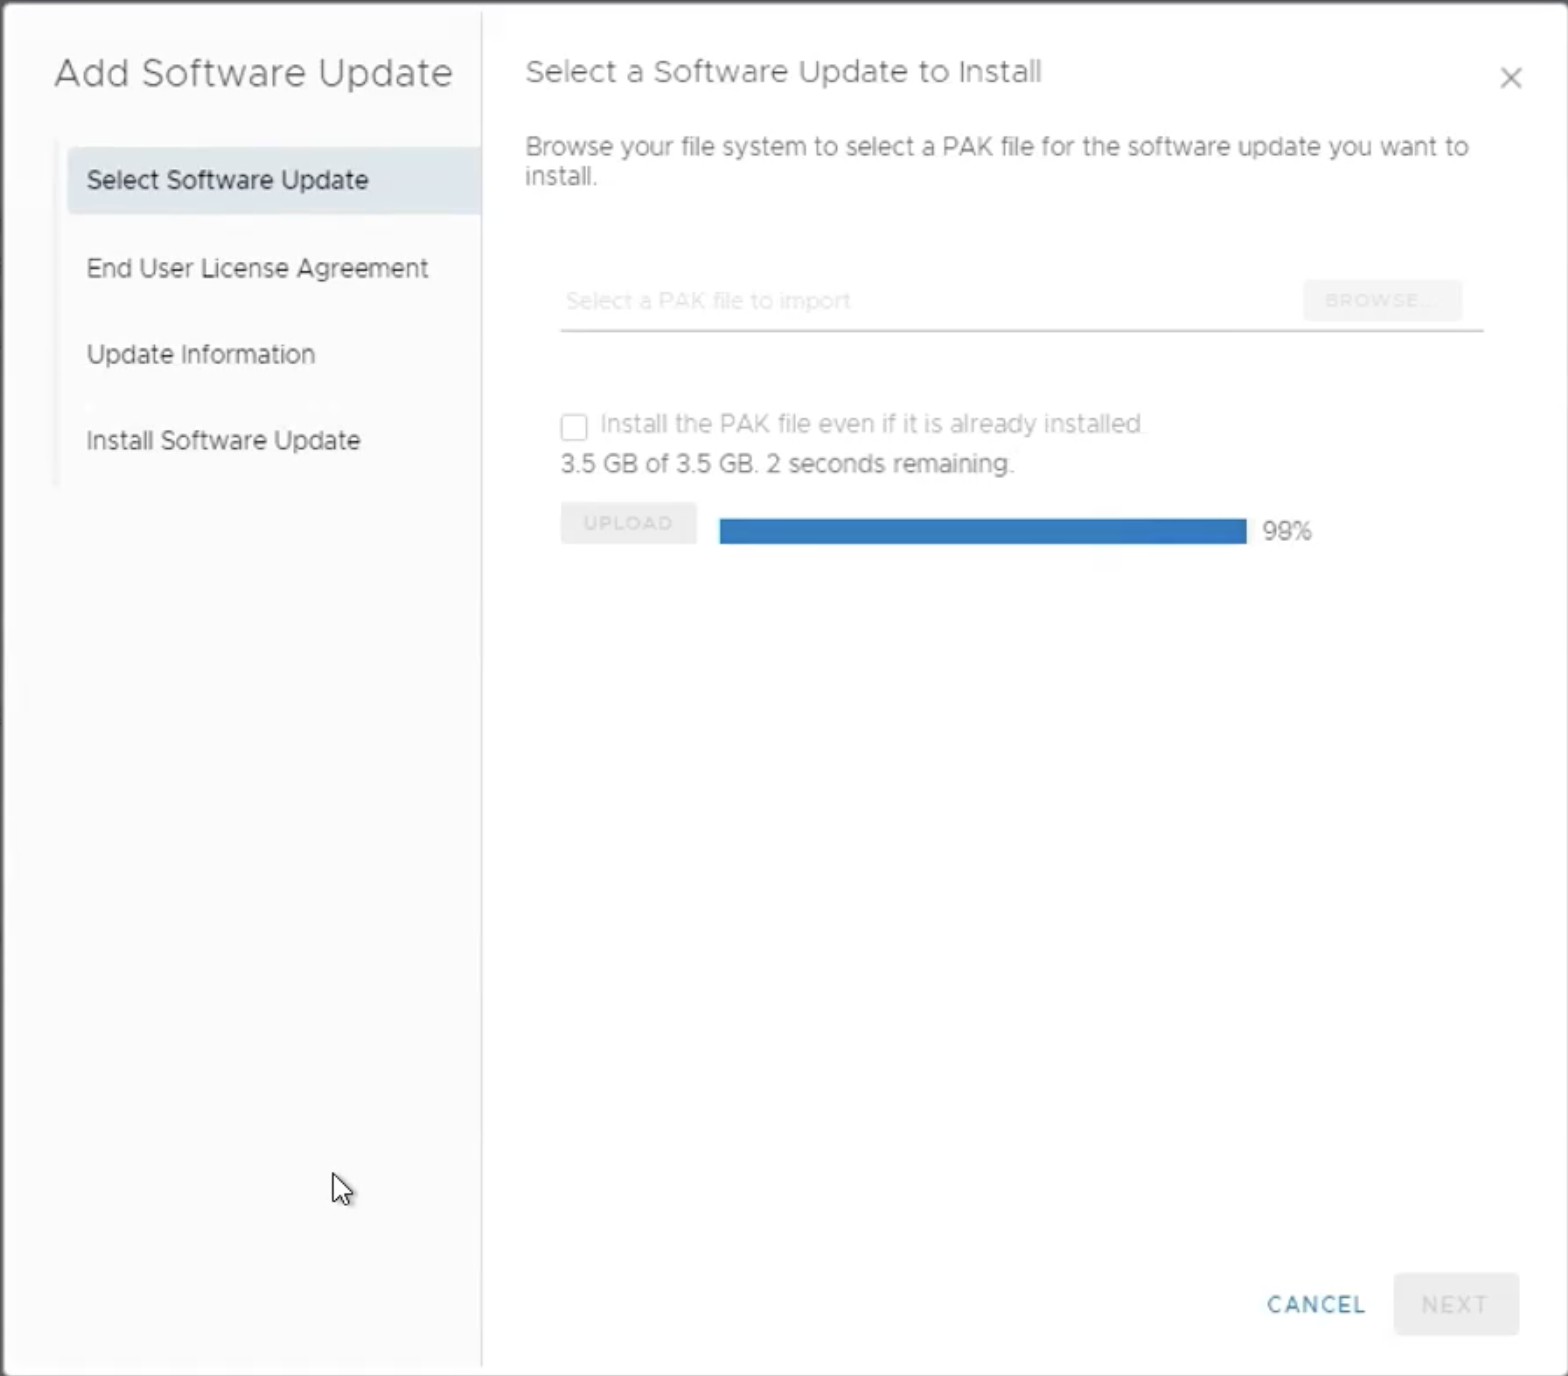
10.Click “UPLOAD” after you’ve browsed the pack file.
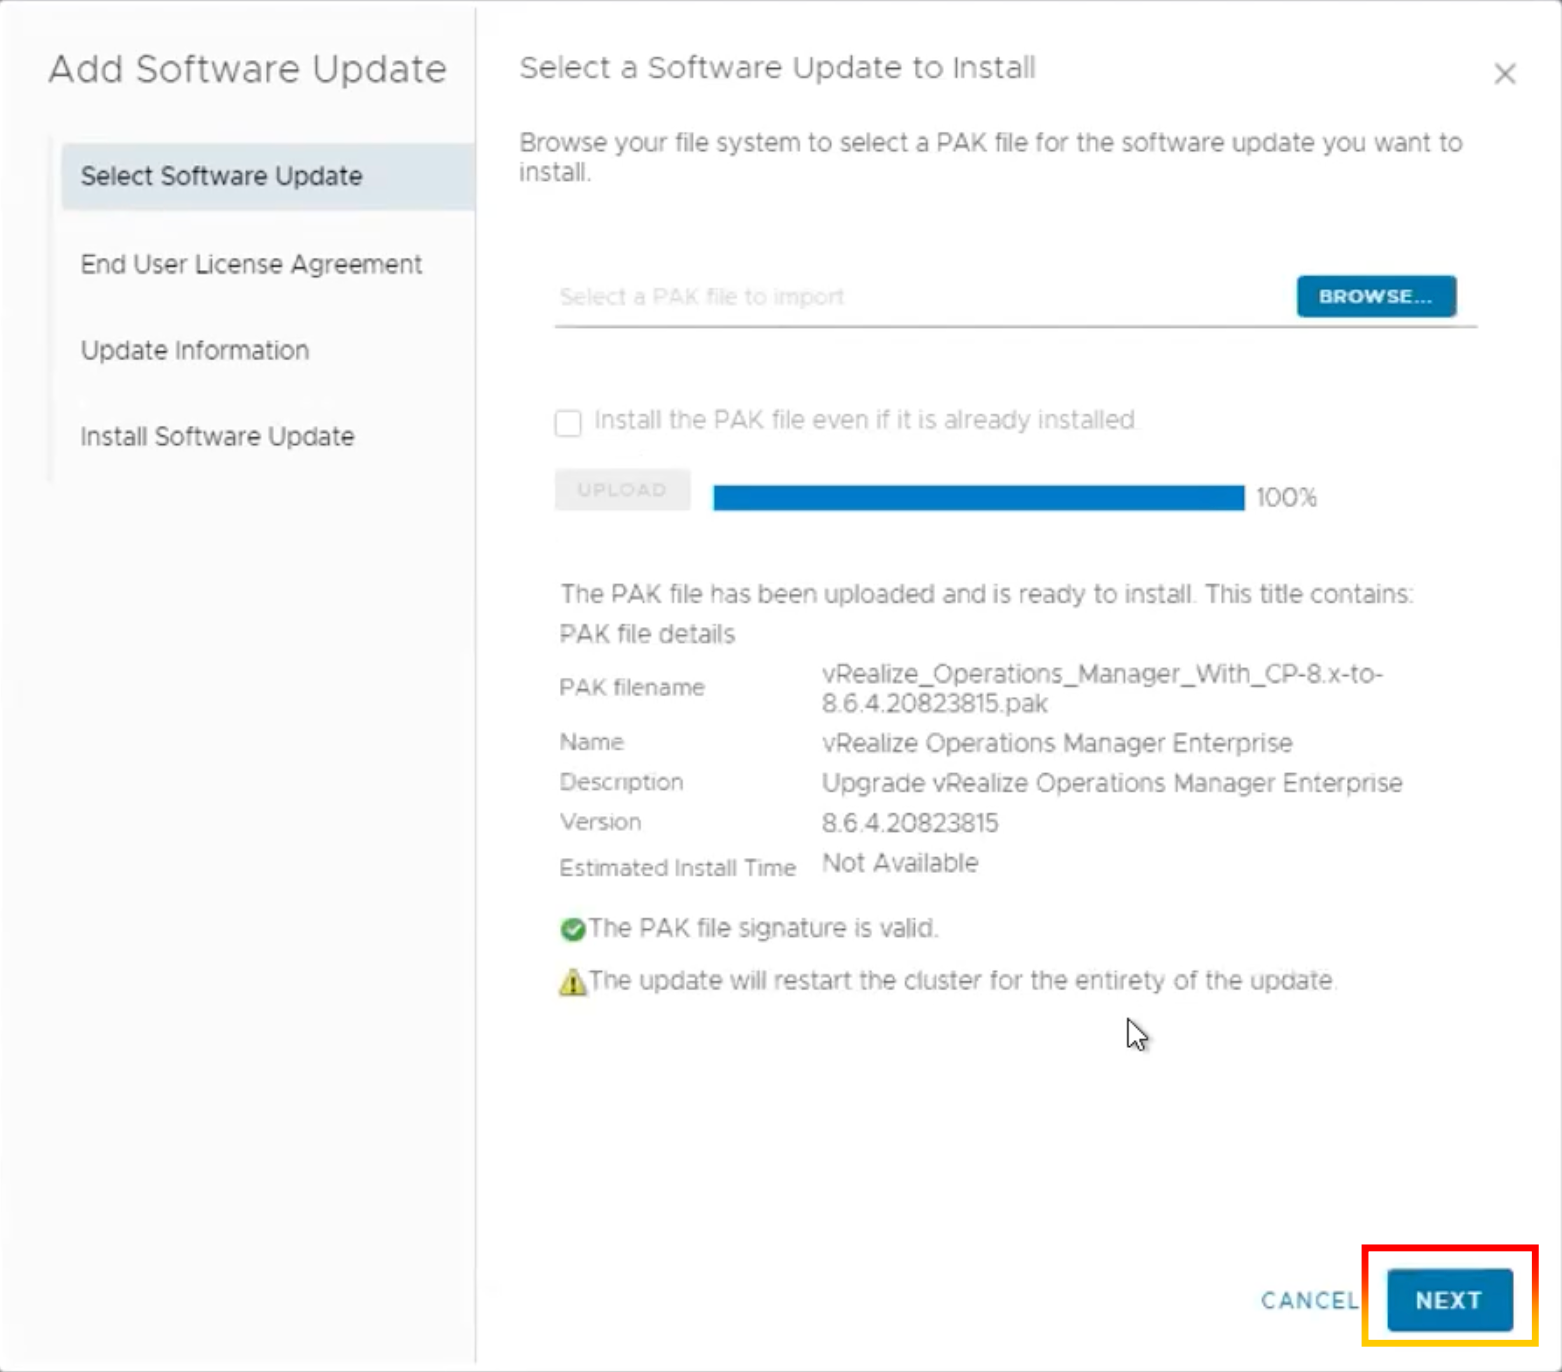
11.The pack file had been uploaded. Click “NEXT”.
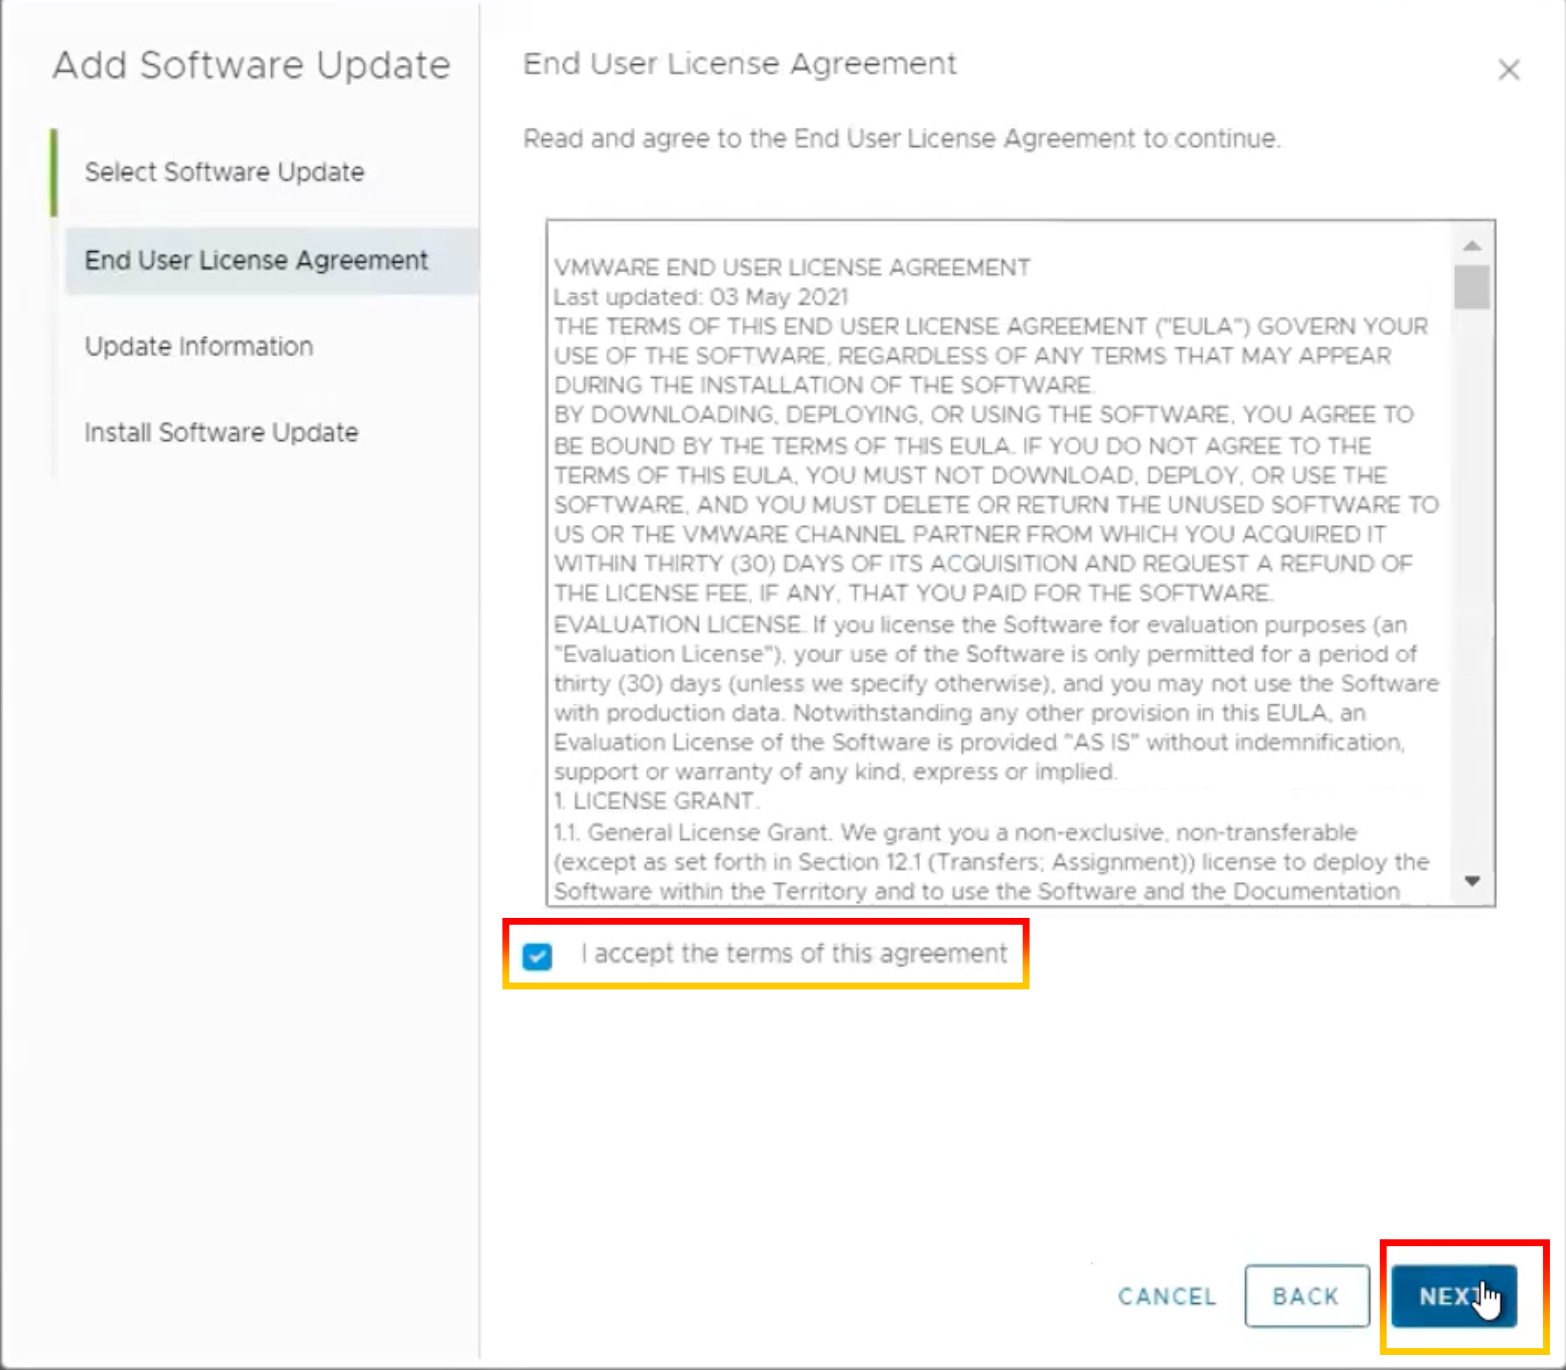
12.To accept the EULA, tick the box, then click “NEXT“.
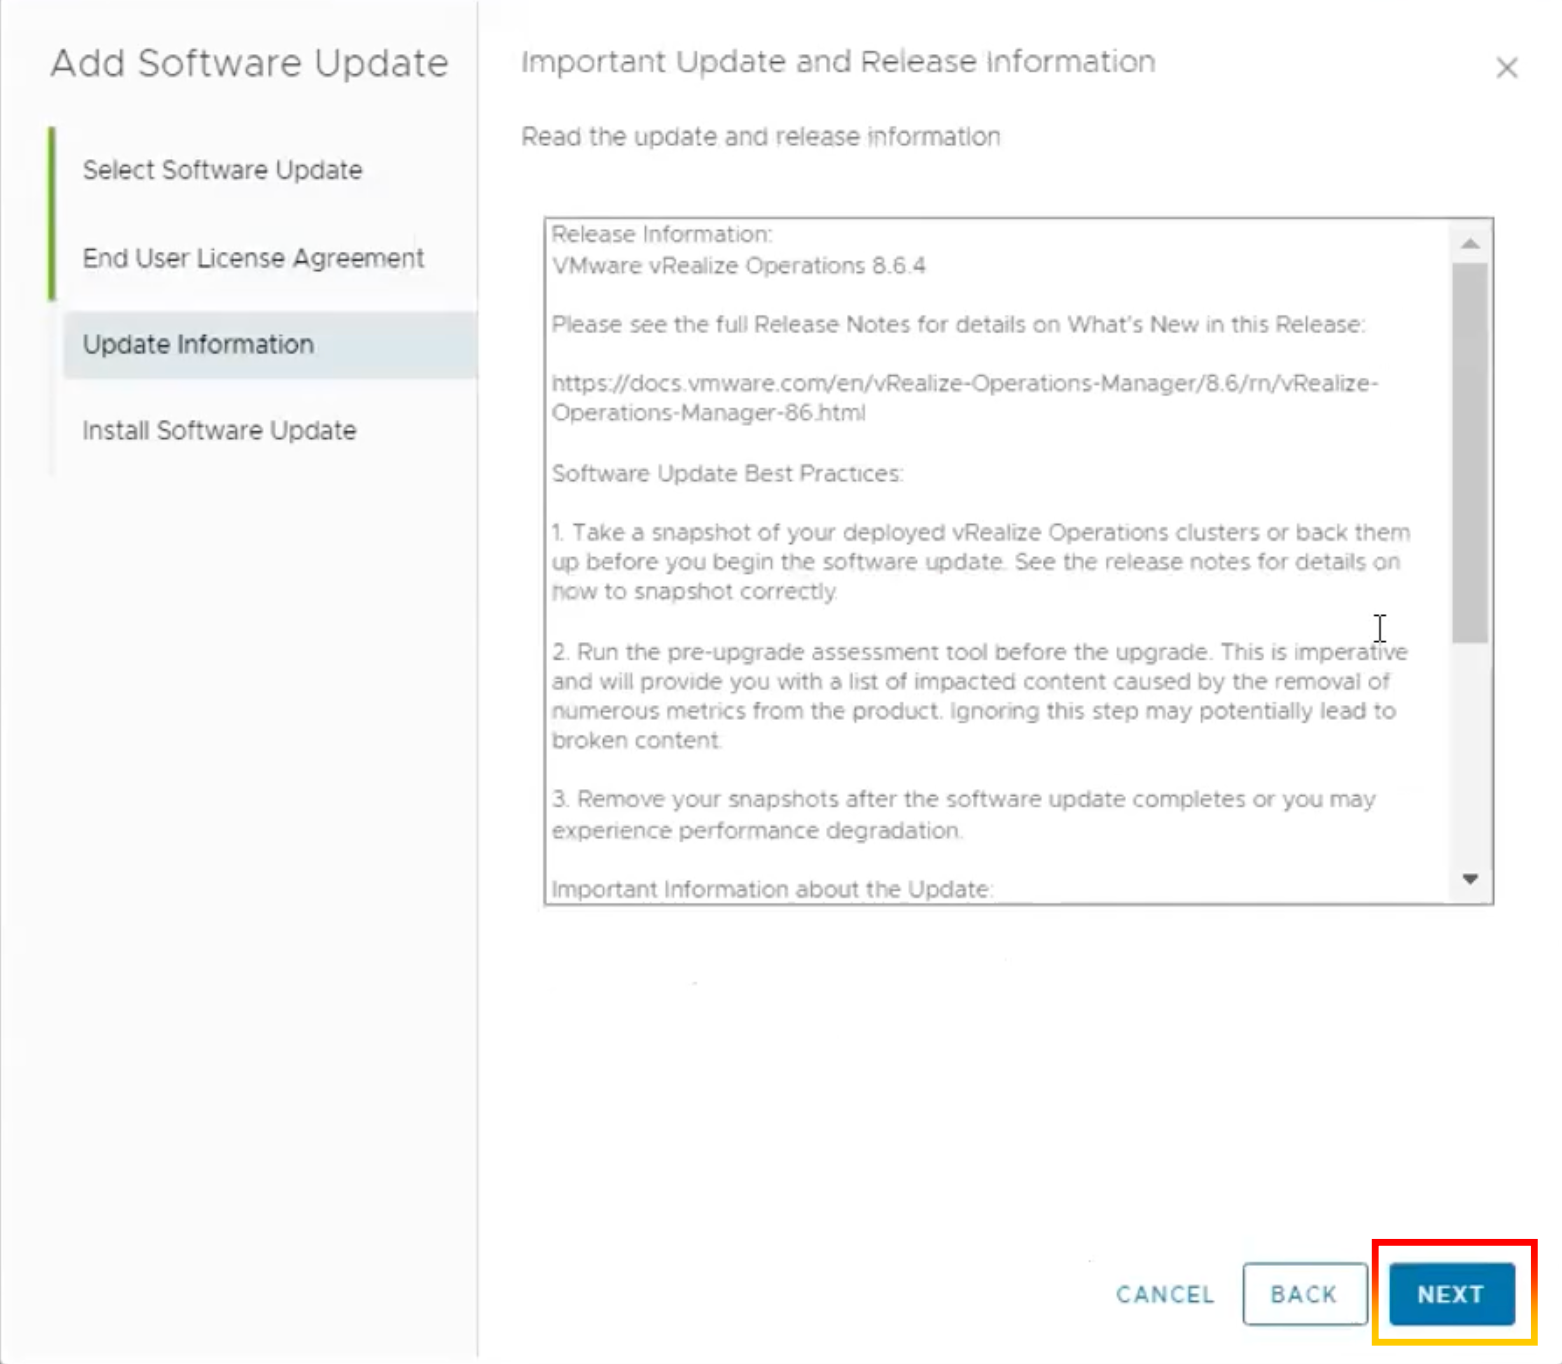
13.After reading the release notes, click “NEXT”.
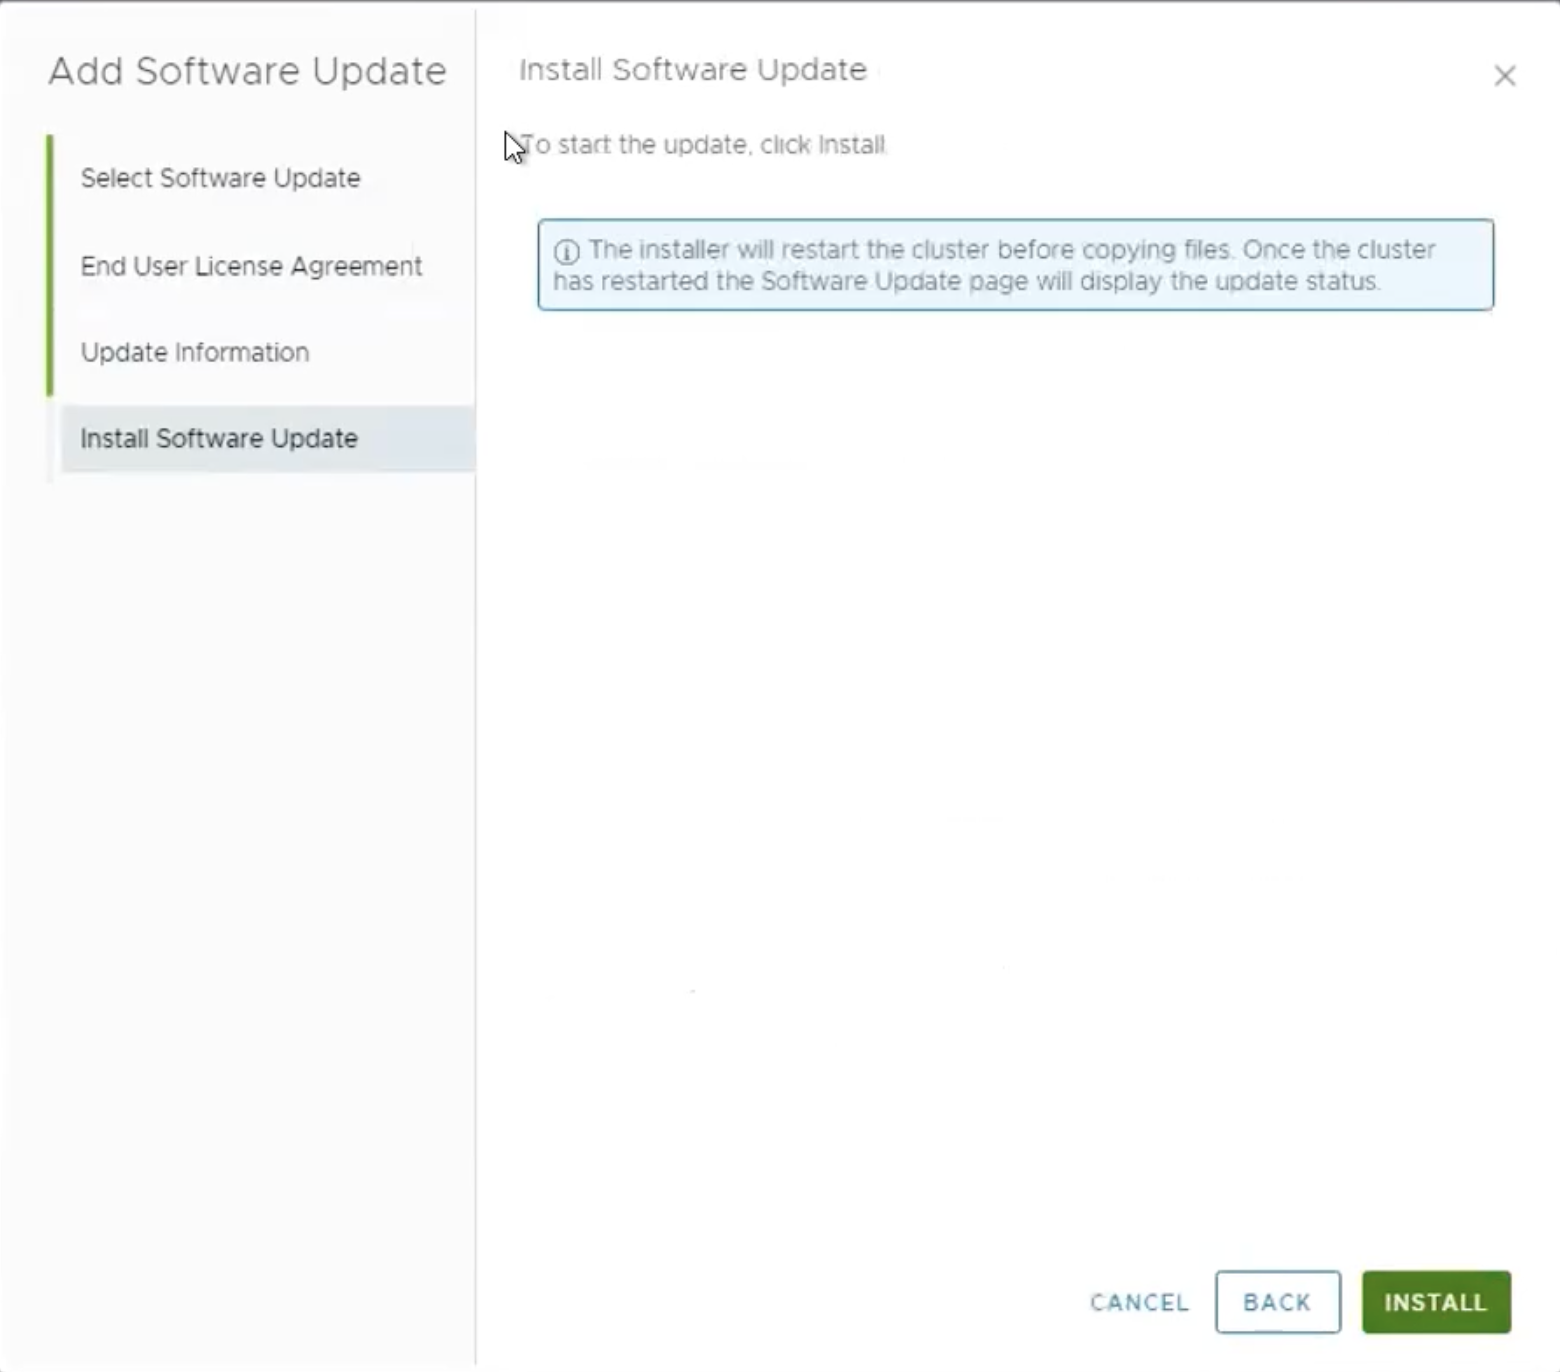
14.To install software, Click “INSTALL”.
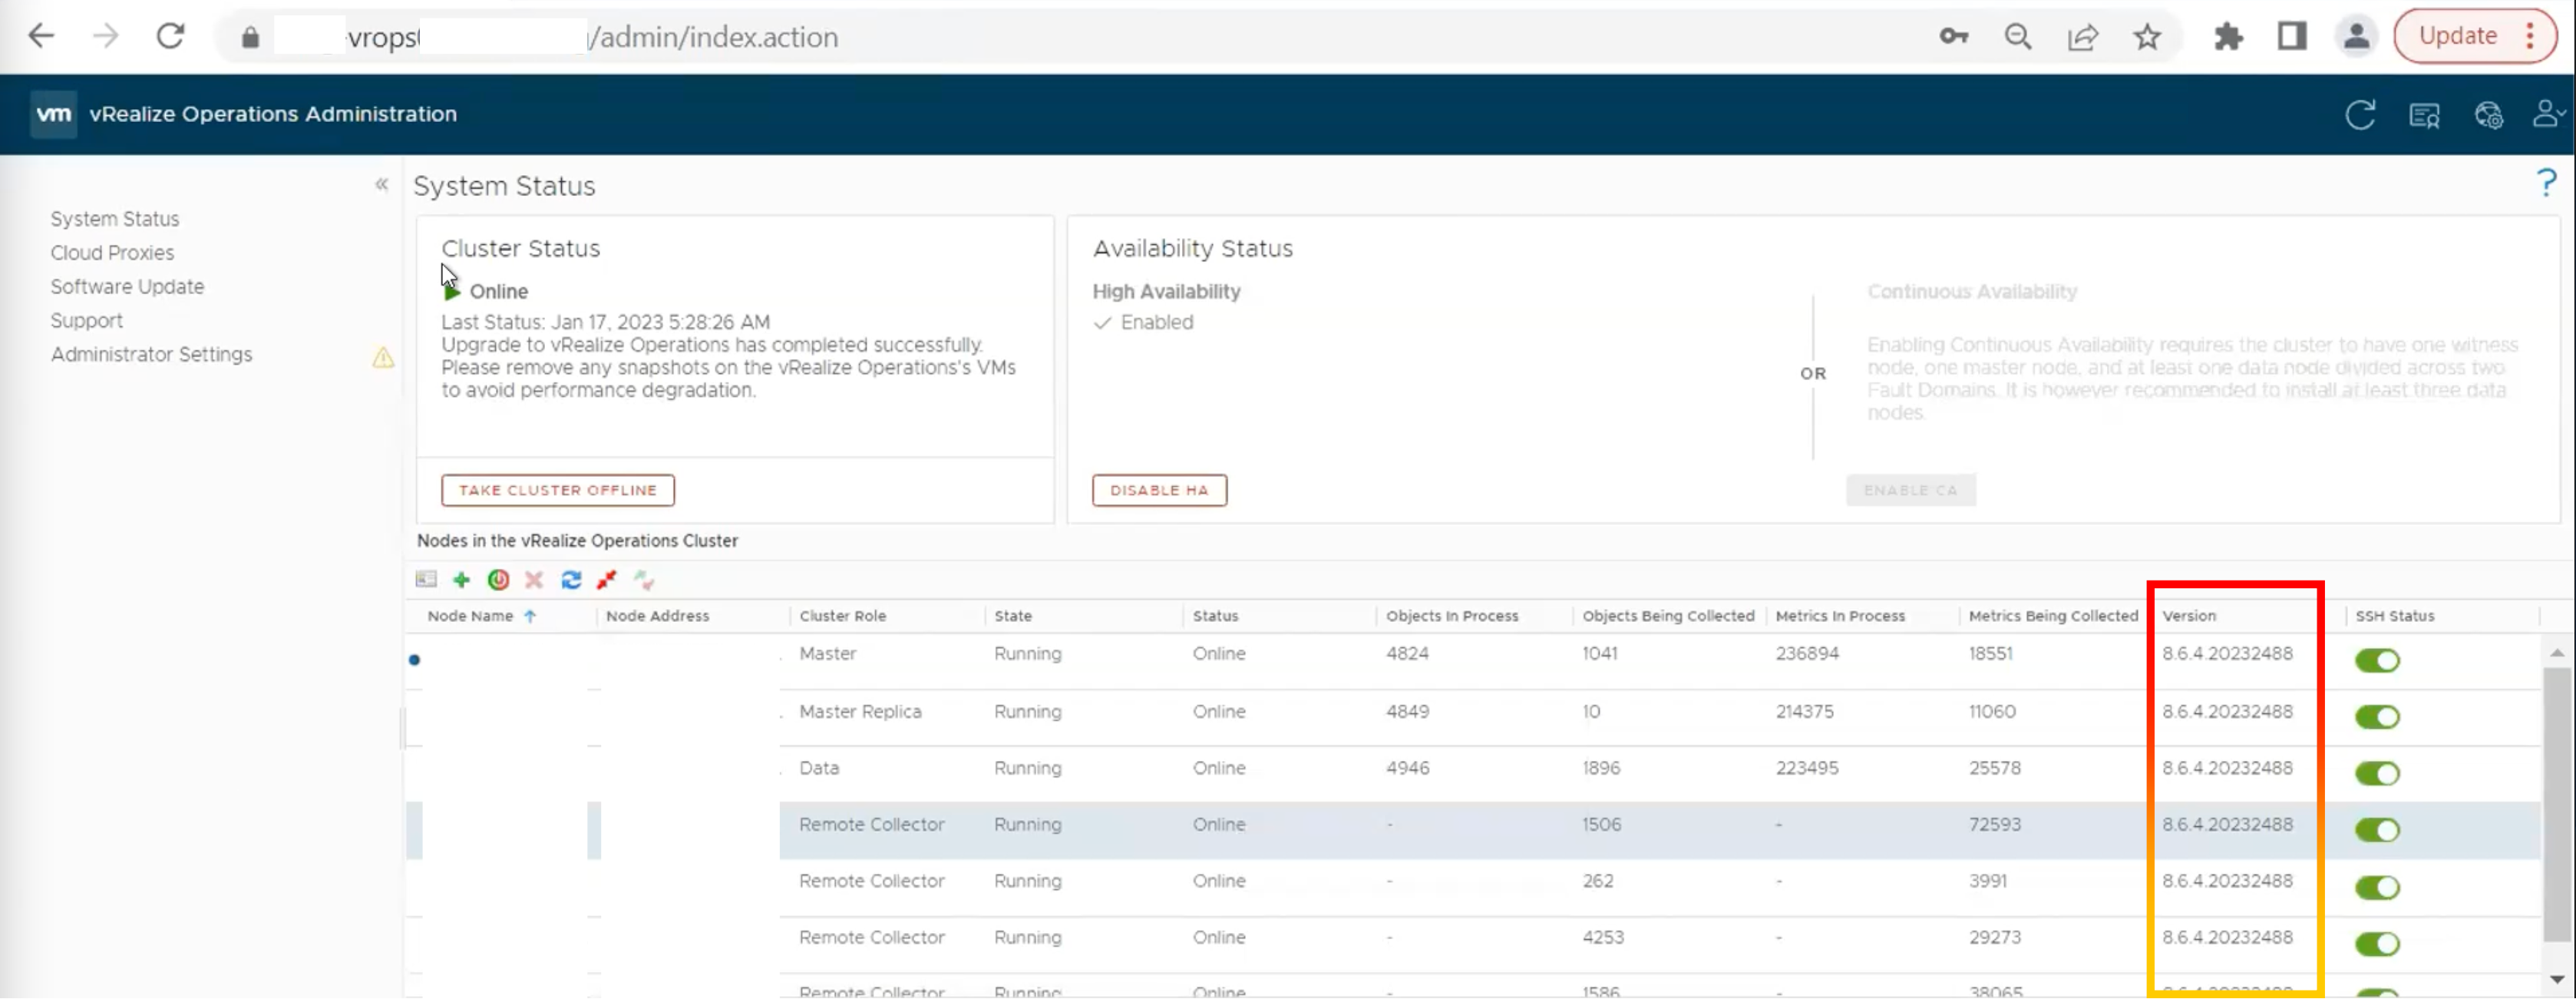
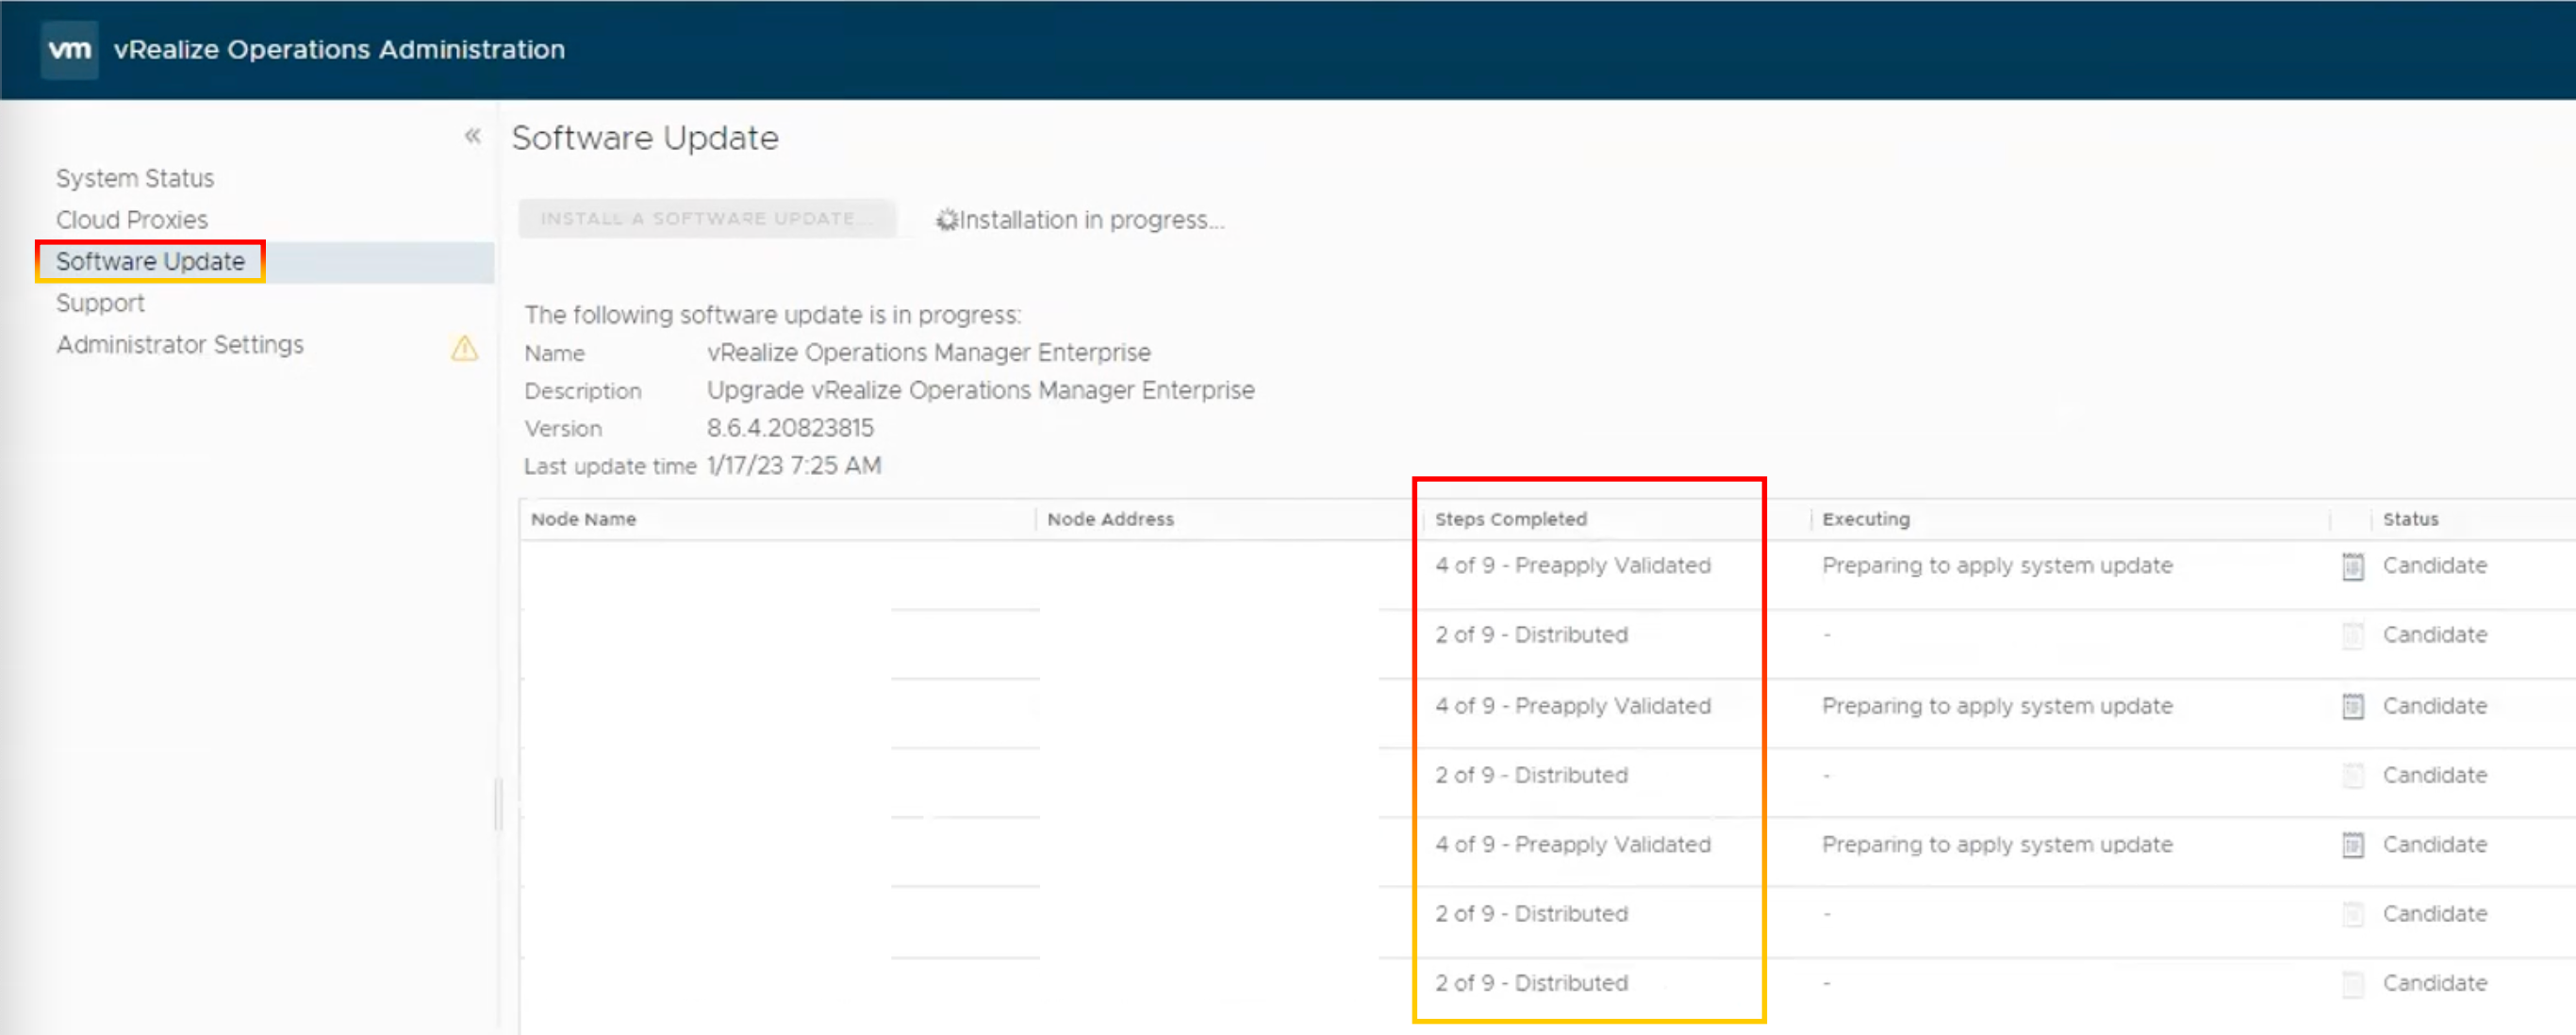
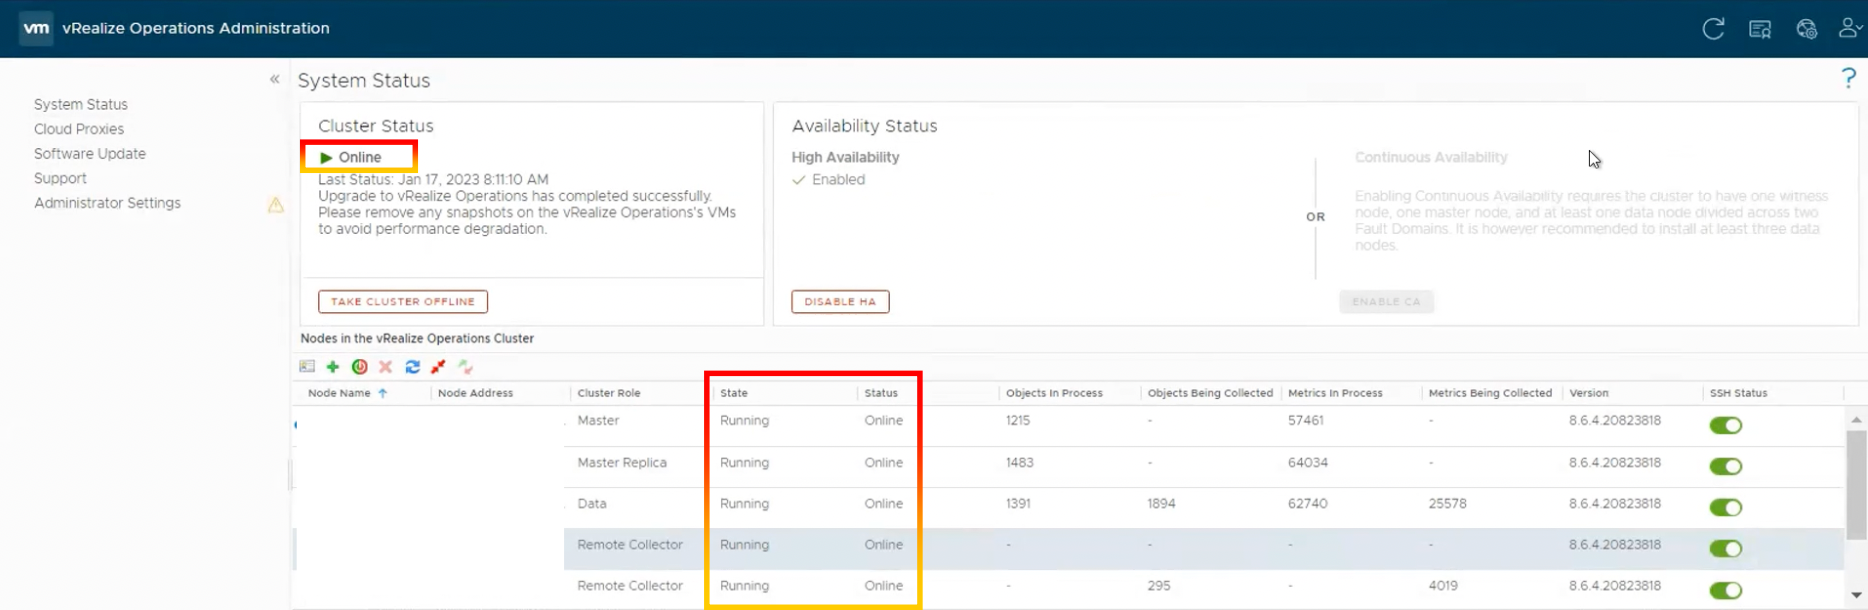
15.The Administrator interface logs you out. Return to the primary node Administrator interface. In the left side, click Software Update. The update patch status will be shown.
16.Waiting for the pack to be installed.
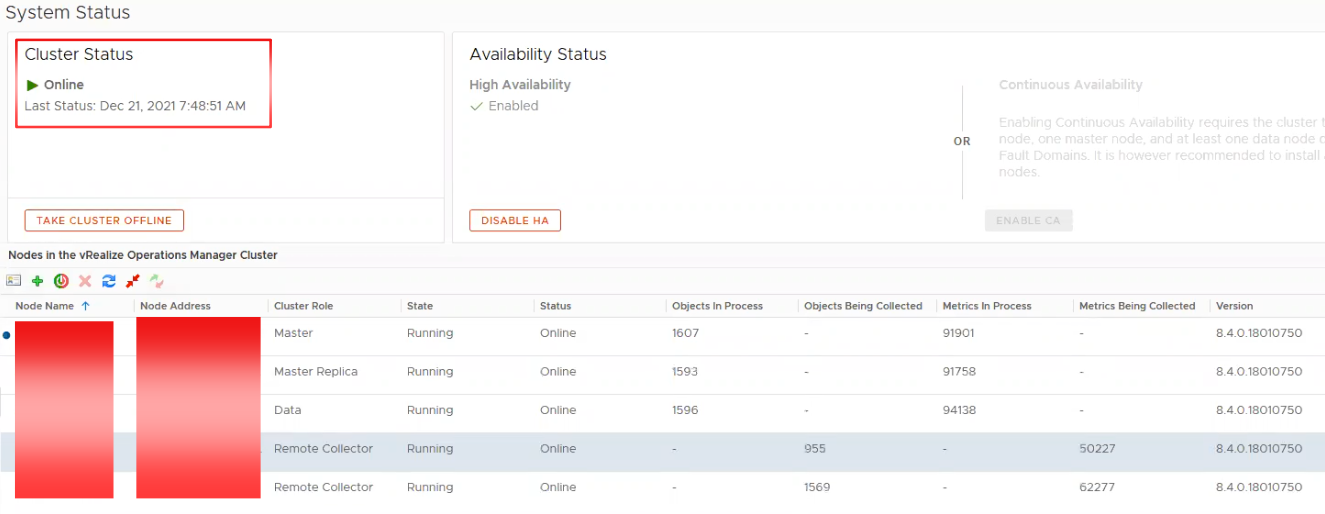
17.Refresh the page. The cluster status is changed to Online.
18.Once the upgrade is finished, delete the snapshots you took prior to the software update.
Guidance and Technical Recommendations.
VMware security advisory with critical security severity for VMware vRealize Operations was released. A major vulnerability was discovered in VMware vRealize Operations. Using administrator rights in the vROps application, a malicious actor can get root access to the underlying operating system. We advise applying the patch or upgrading to the patched version to preventing a malicious attacker from accessing critical information in the vROps.
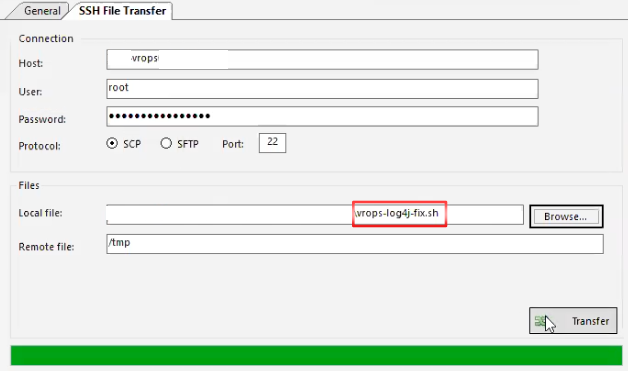
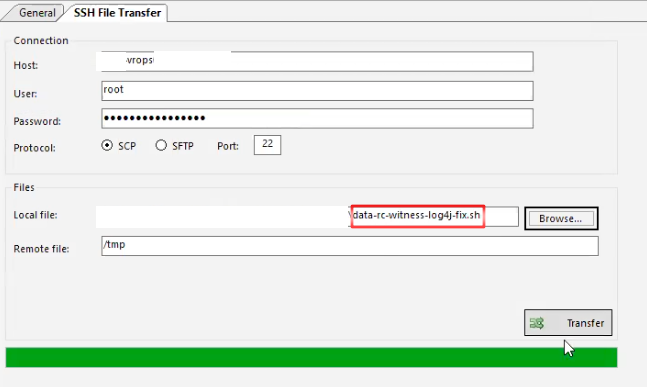
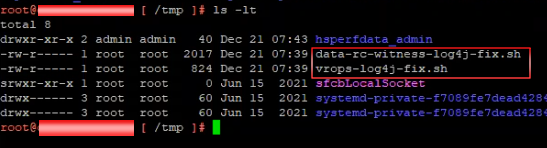
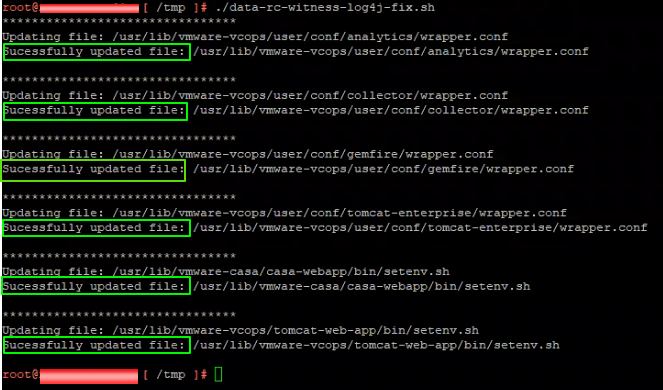
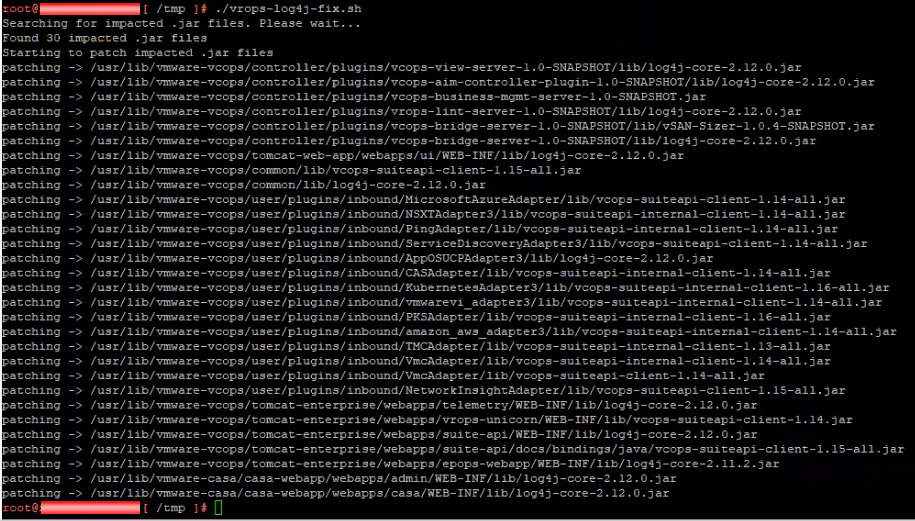
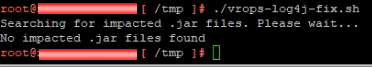
Notice: The below content has been updated as of 12/15/2021 to add workaround steps for the related CVE-2021-45046 as noted above. Please re-run all of the below steps even if you have already implemented the original CVE-2021-44228 workaround steps by running the data-rc-witness-log4j-fix.sh and cp-log4j-fix.sh scripts.
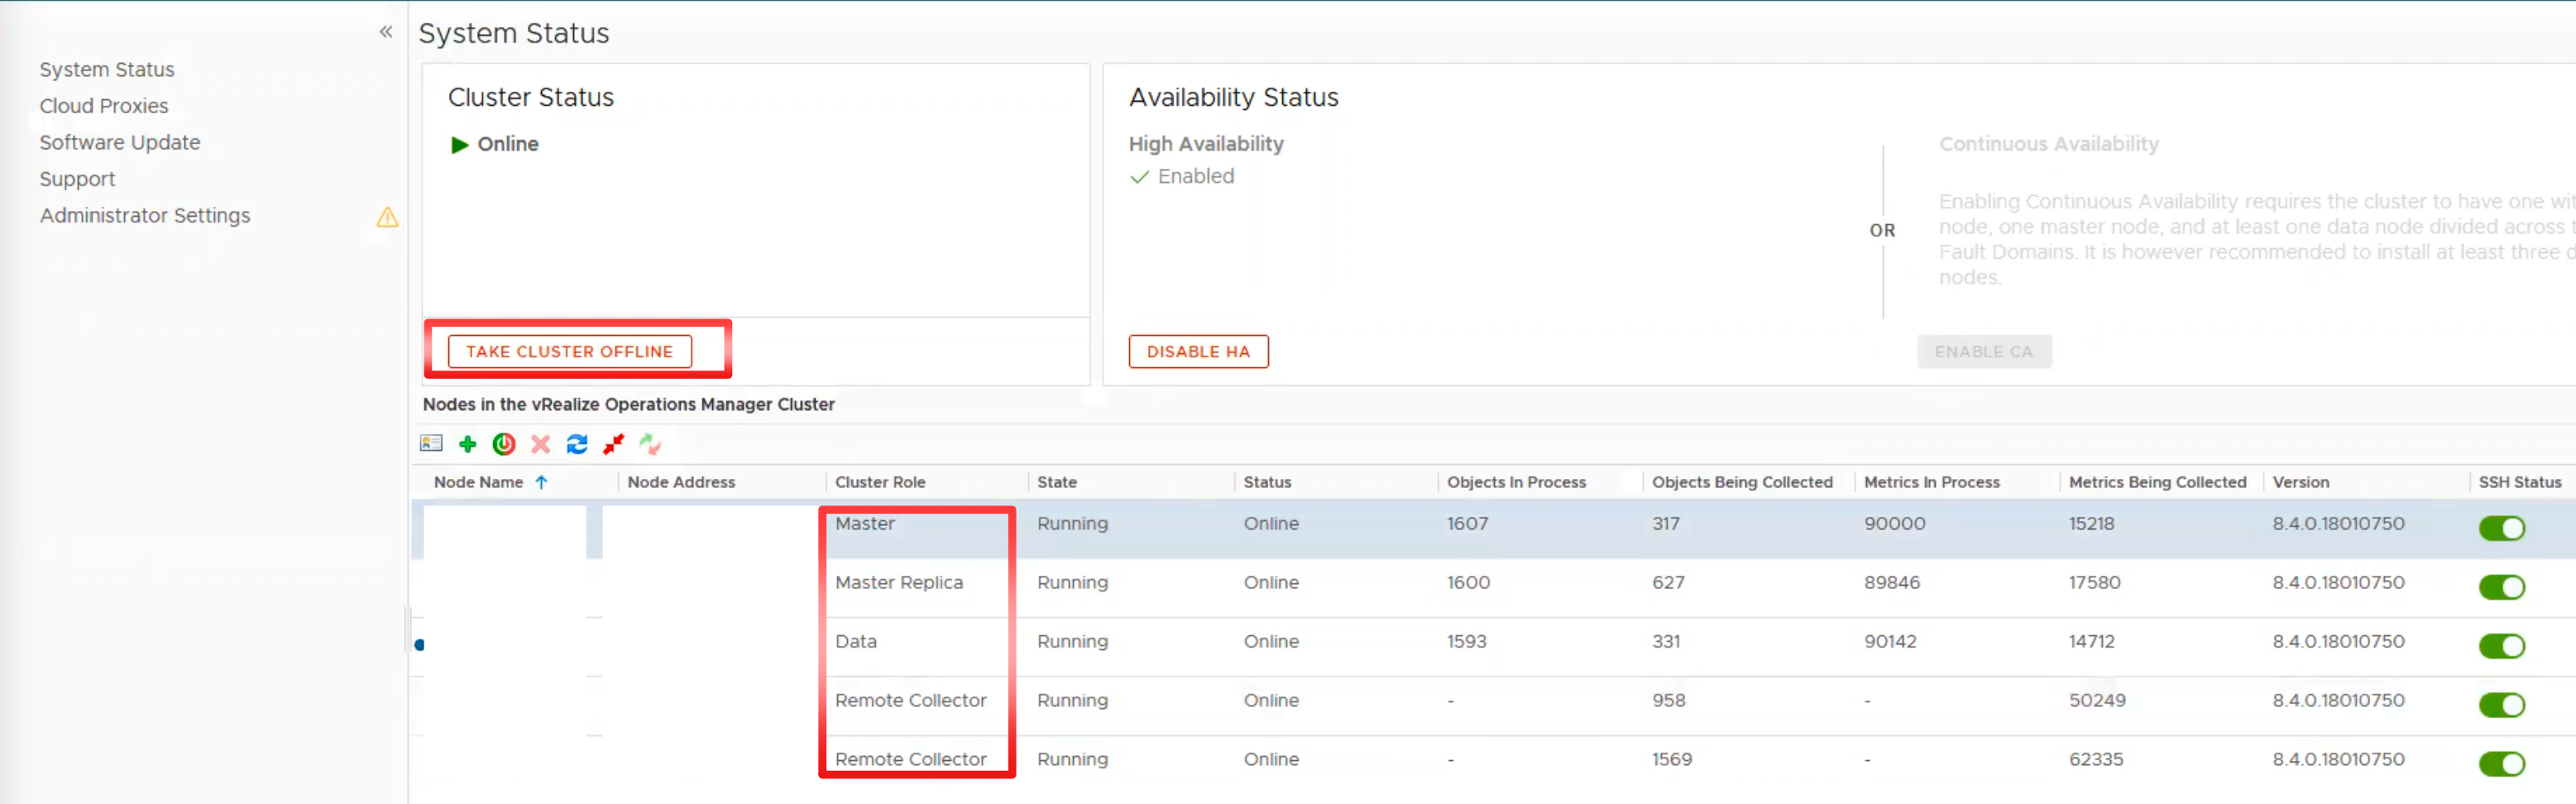
1.ทำการ Log in to the vRealize Operations Manager Admin UI โดยใช้ local admin user (https://vROPs-Name or vROPs-IP/admin).
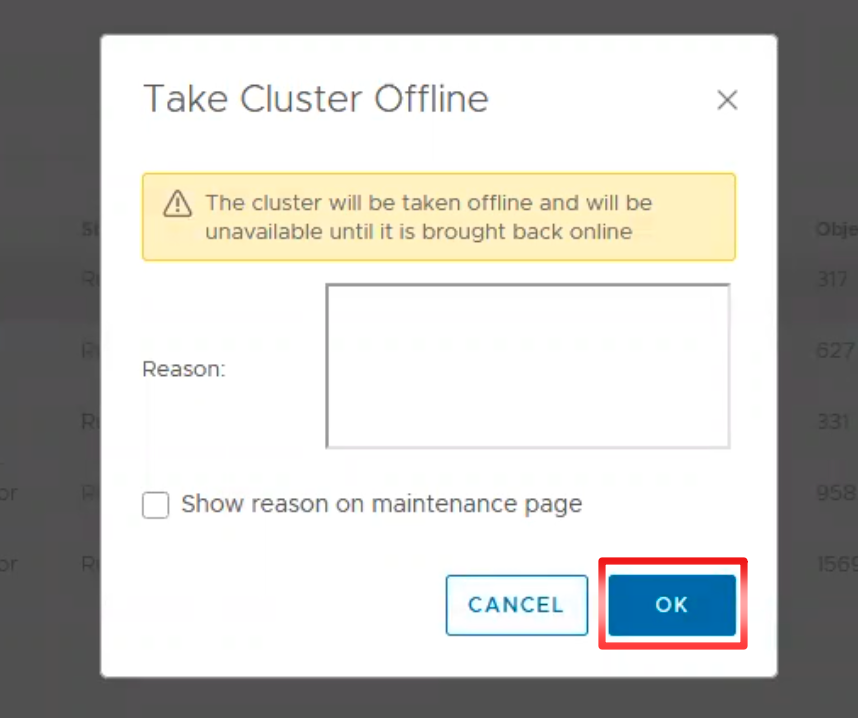
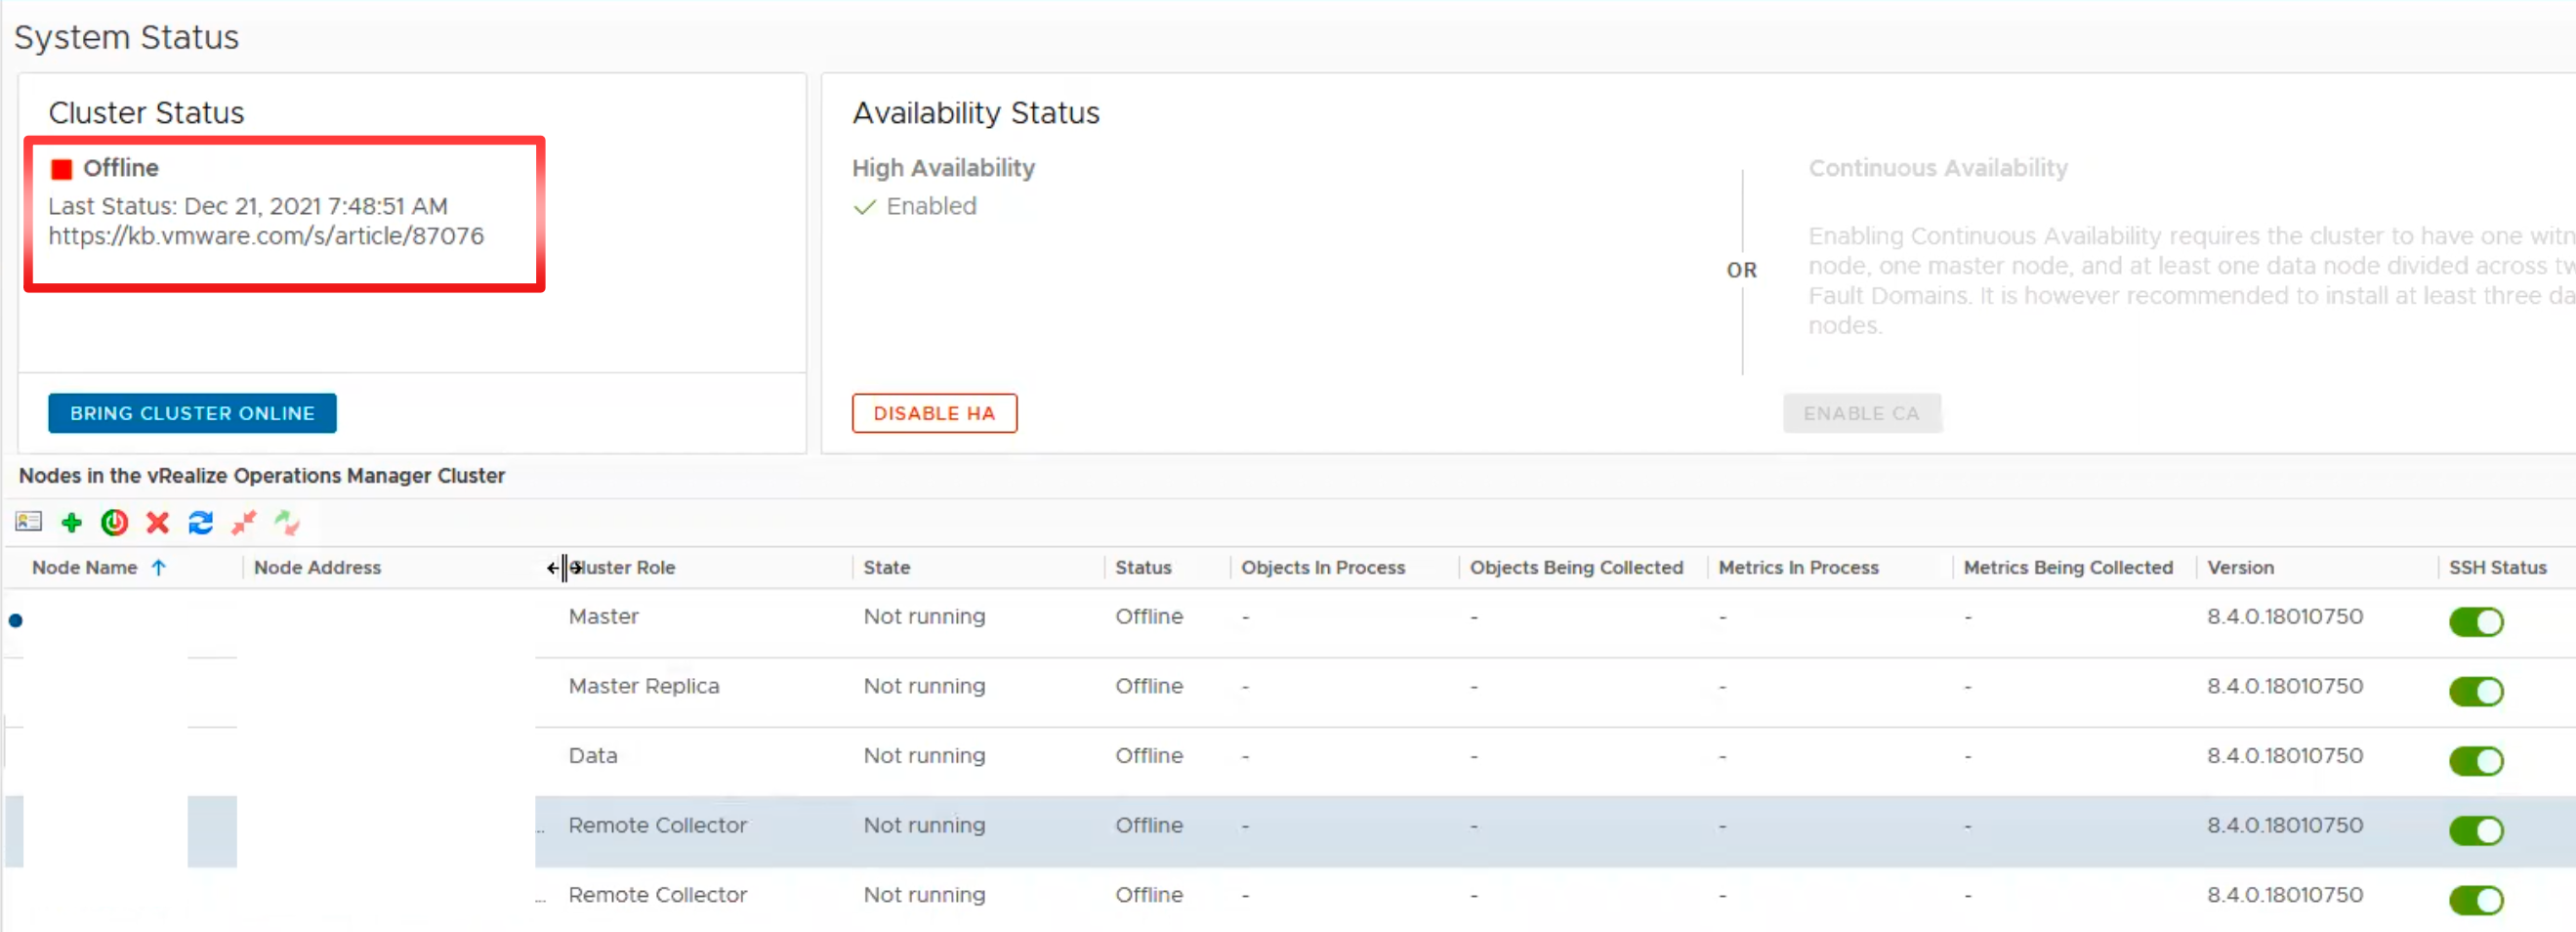
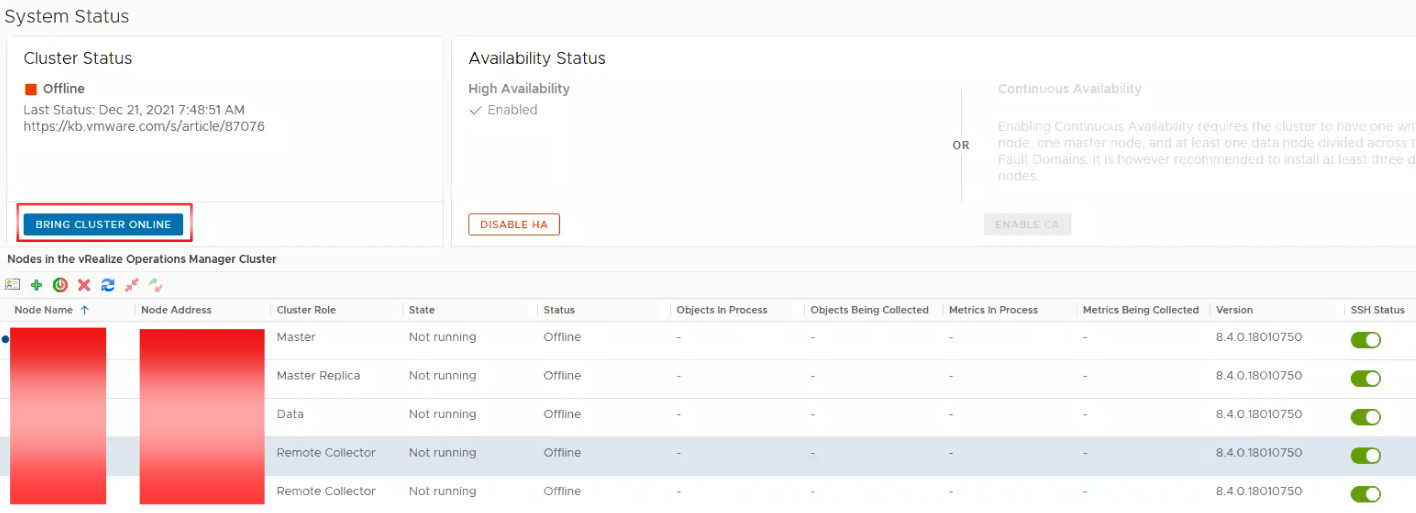
2.ทำการ Click “TAKE CLUSTER OFFLINE” under Cluster Status.
Note: Wait for Cluster Status to show as Offline. ถ้าเราพบว่าหน้า vROPs admin จะไม่สามารถ access ได้ ให้เรา access โดยตรงไป ที่ vROPs Master node IP address (https://vROPs-Master node name or IP address/admin).
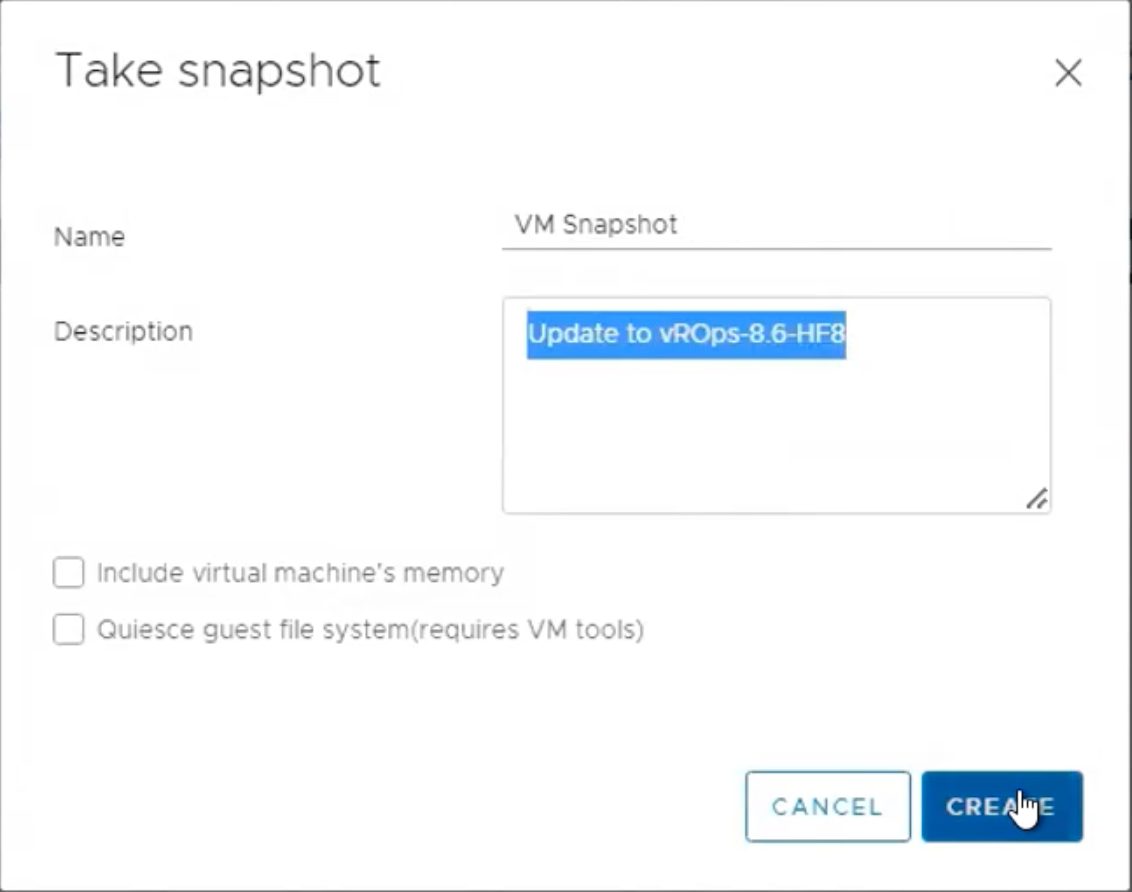
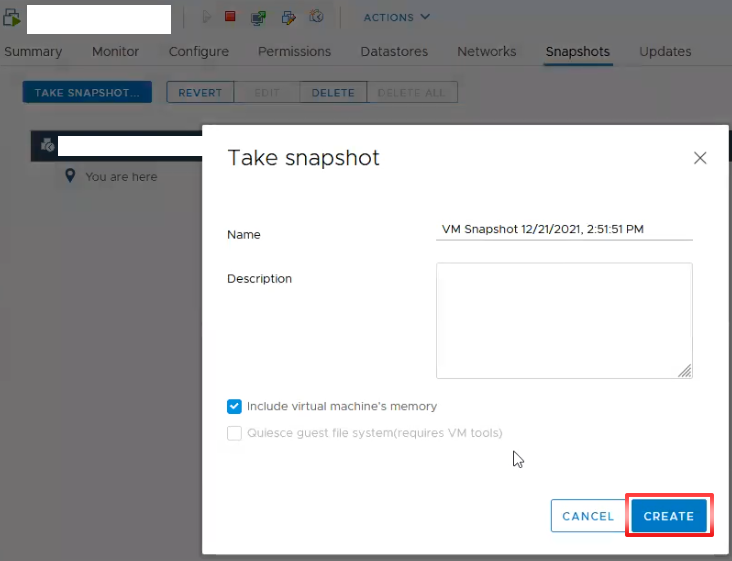
3.ทำการ take snapshots vRealize Operations nodes ทั้ง 5 nodes [Analytic (Primary, Replica, Data), Remote Collector 2 nodes] ก่อนจะ apply workaround (How to take a Snapshot of vRealize Operations.).
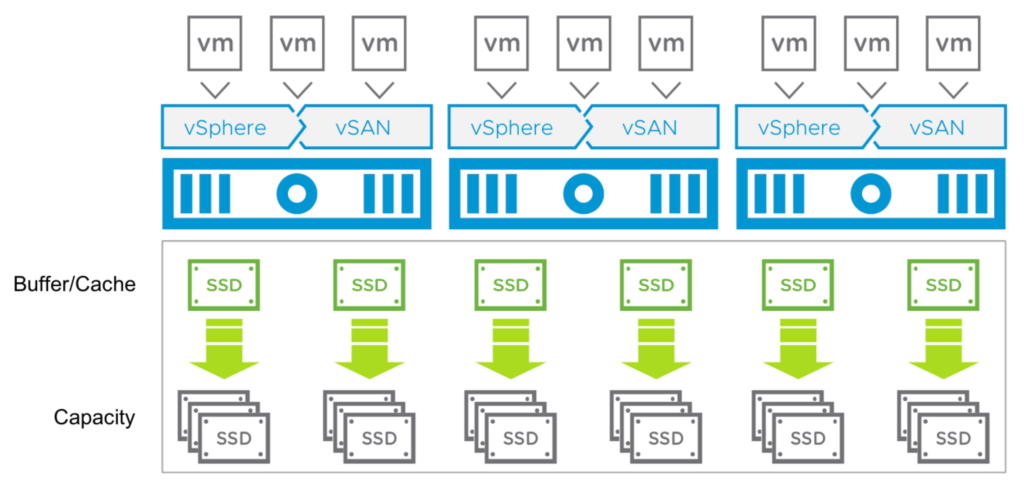
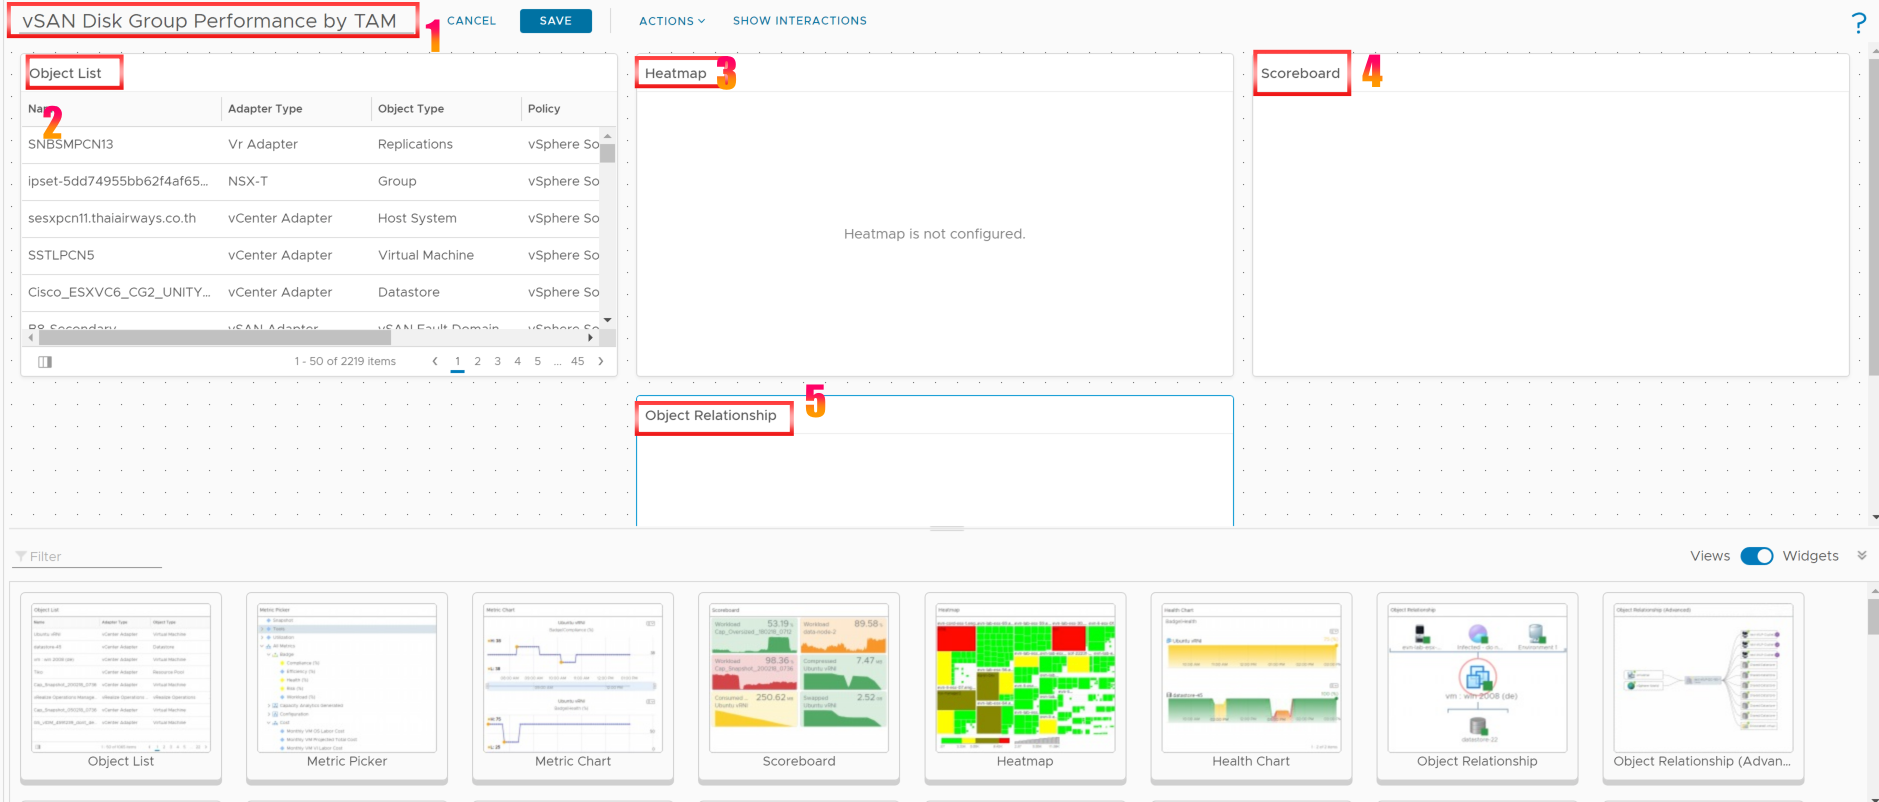
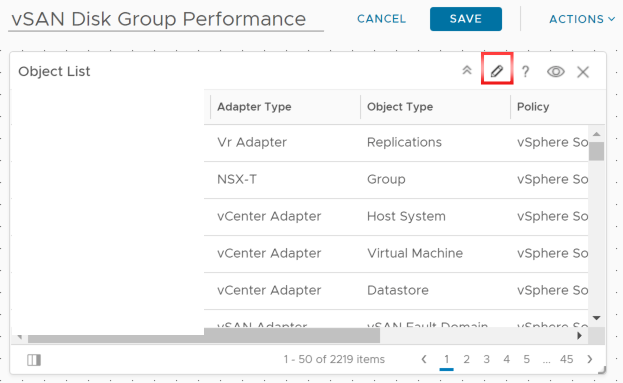
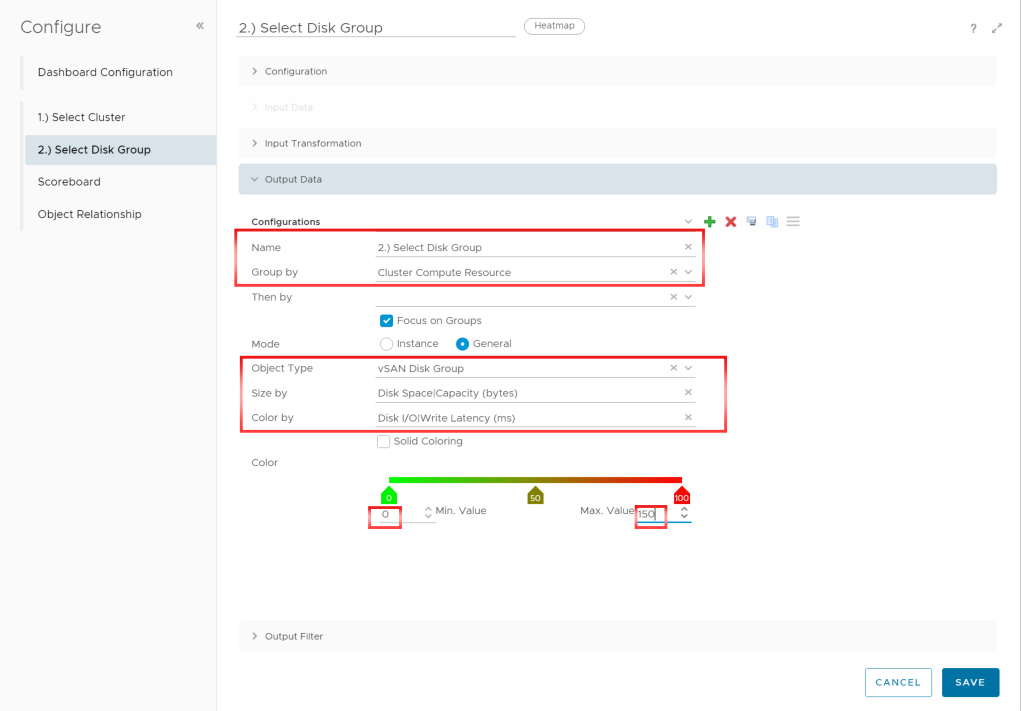
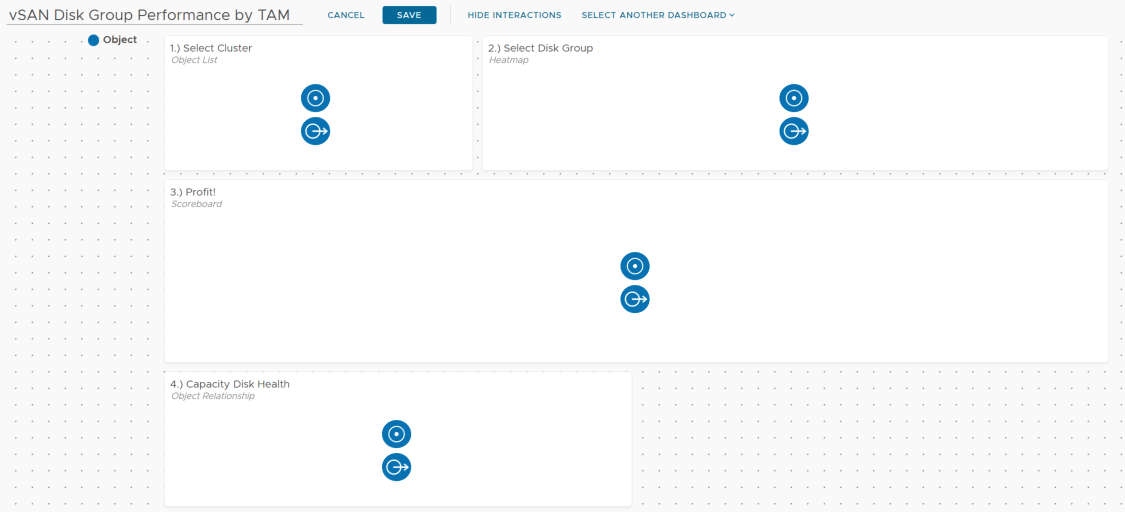
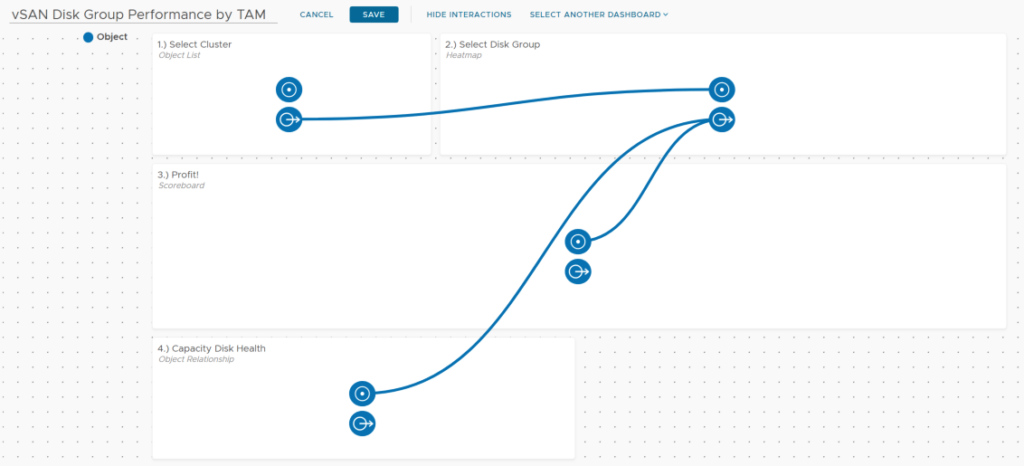
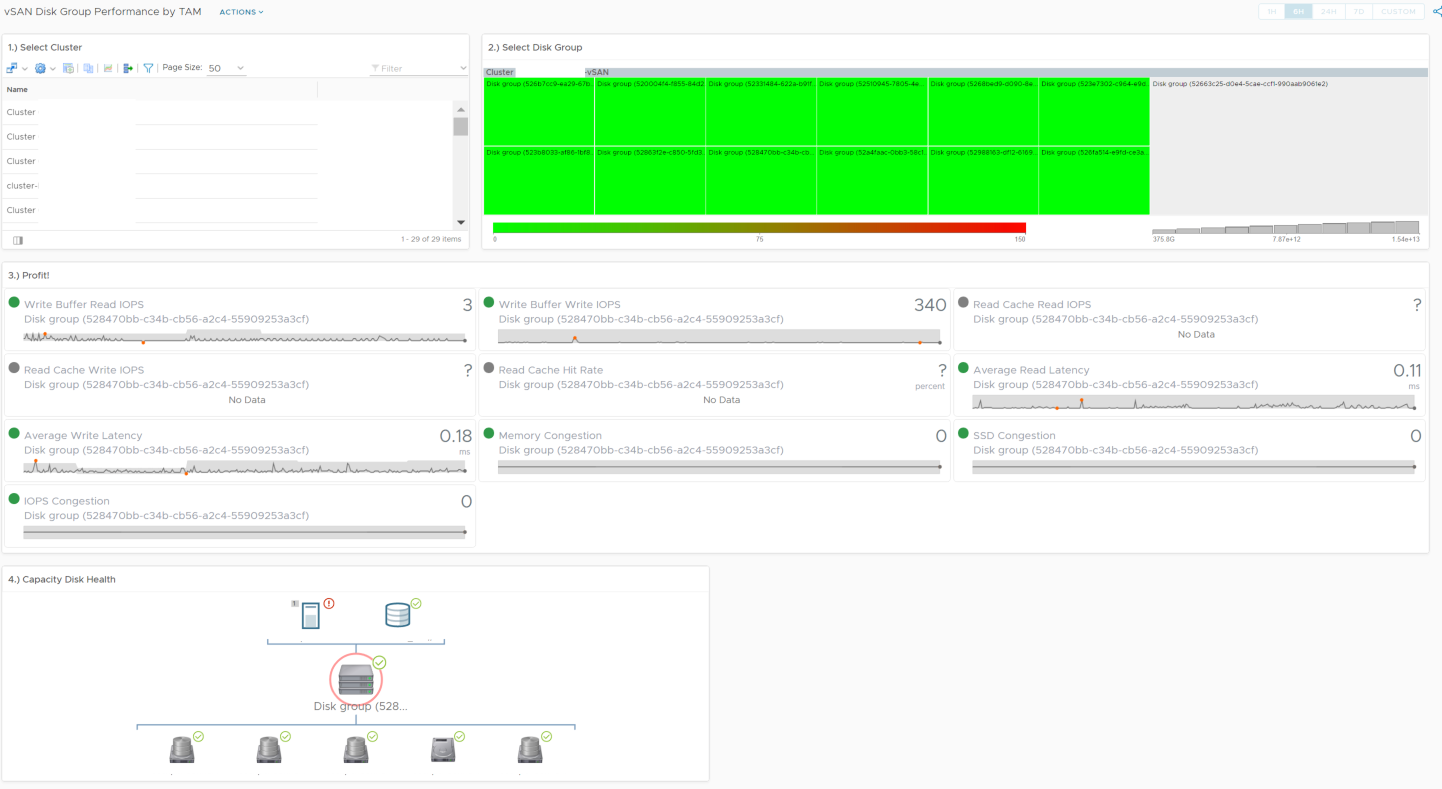
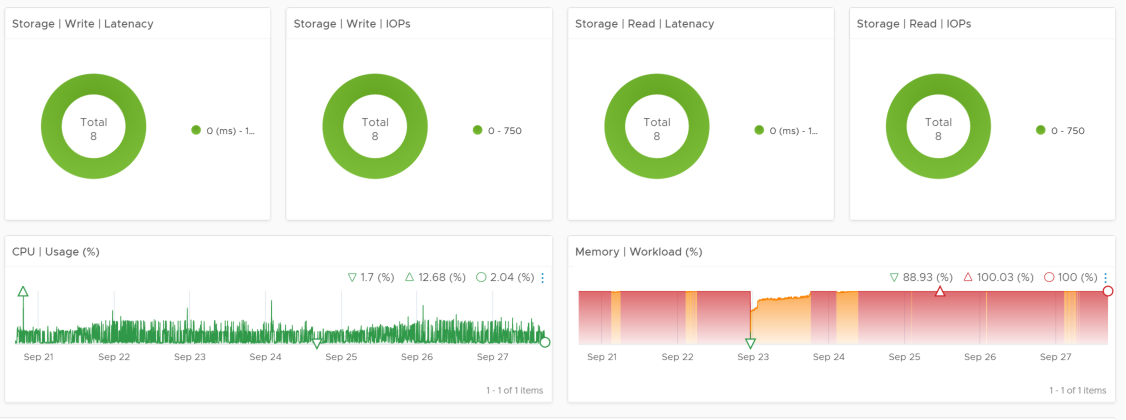
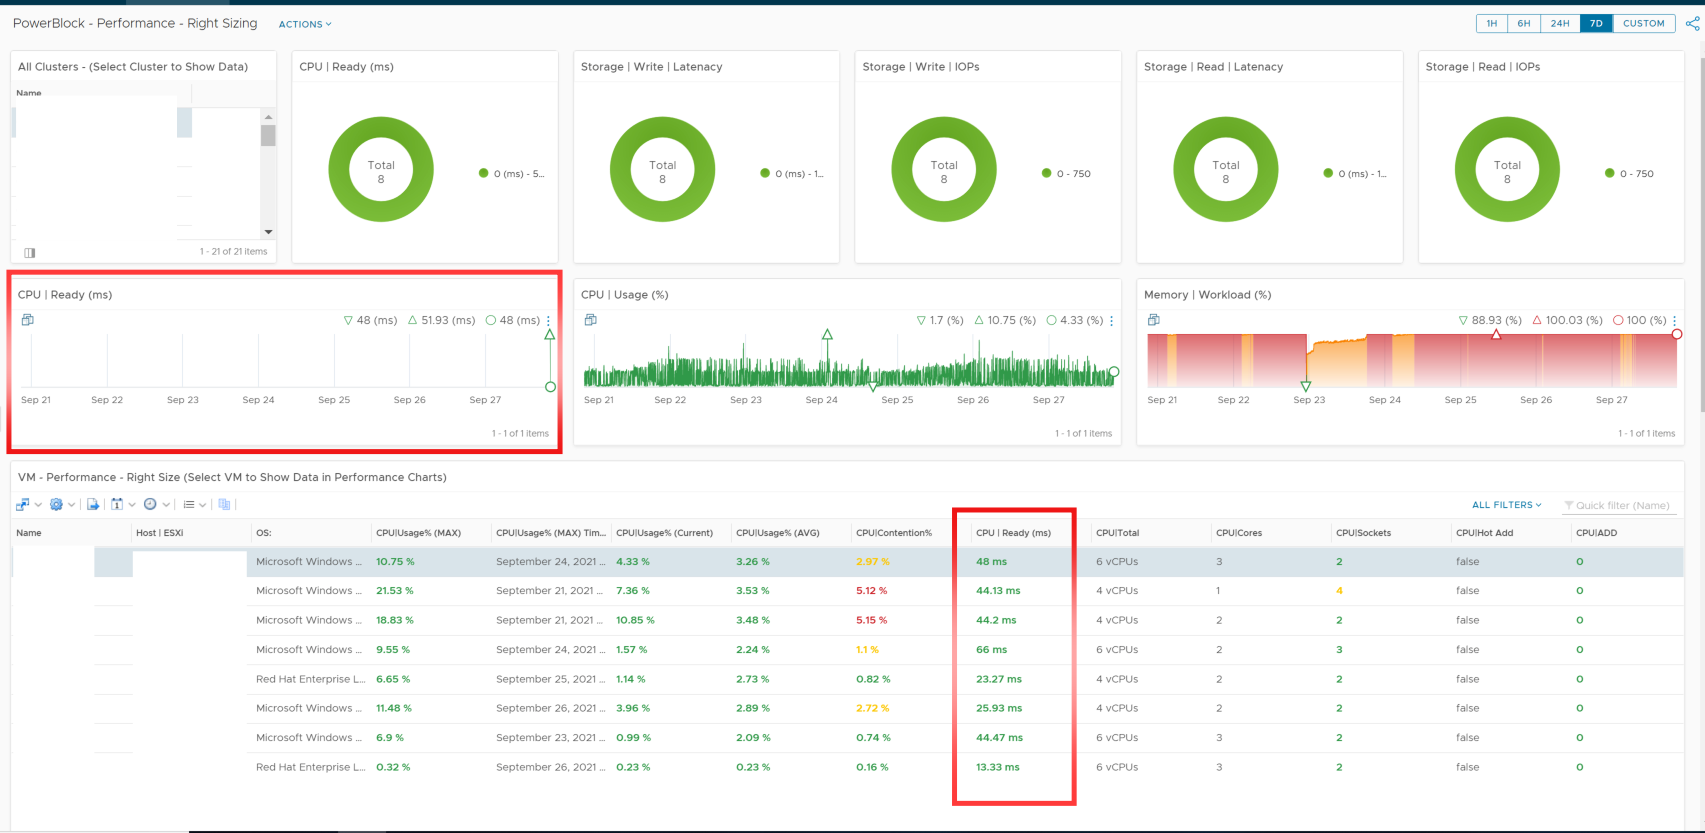
เราจะมีวิธีการอย่างไร ในการ monitor performance ของ vSAN disk groups. โดยเราสามารถ เลือกในแต่ละ Cluster แล้วทำการ monitor performance vSAN disk group รวมถึง health capacity.
Note: vRealize Operations Manager ที่นำมาใช้งานในบทความนี้เป็น version 8.4.0 (17863947) Advanced Edition
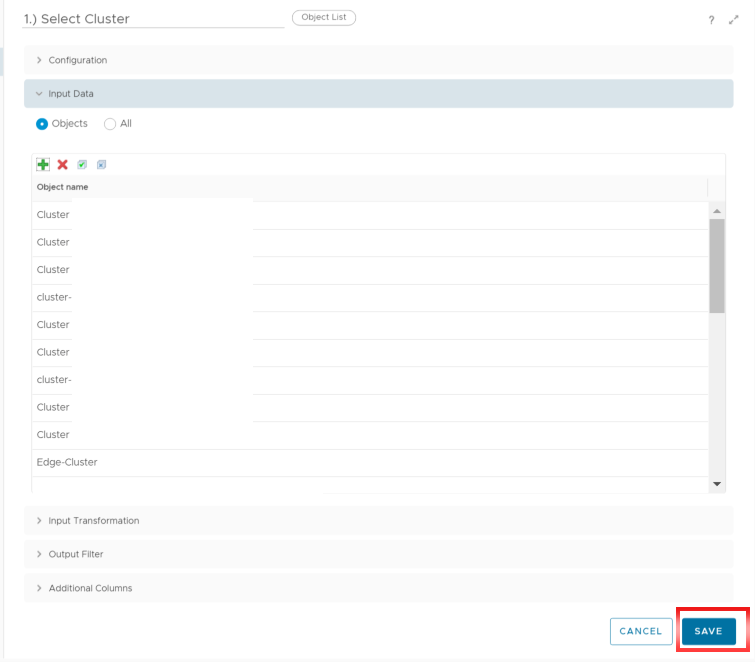
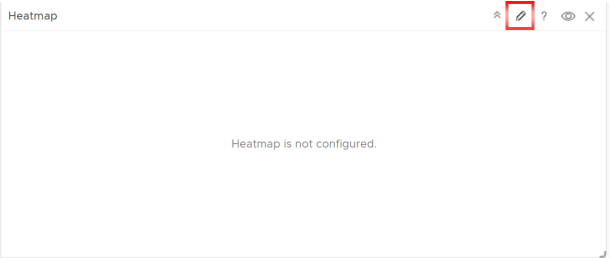
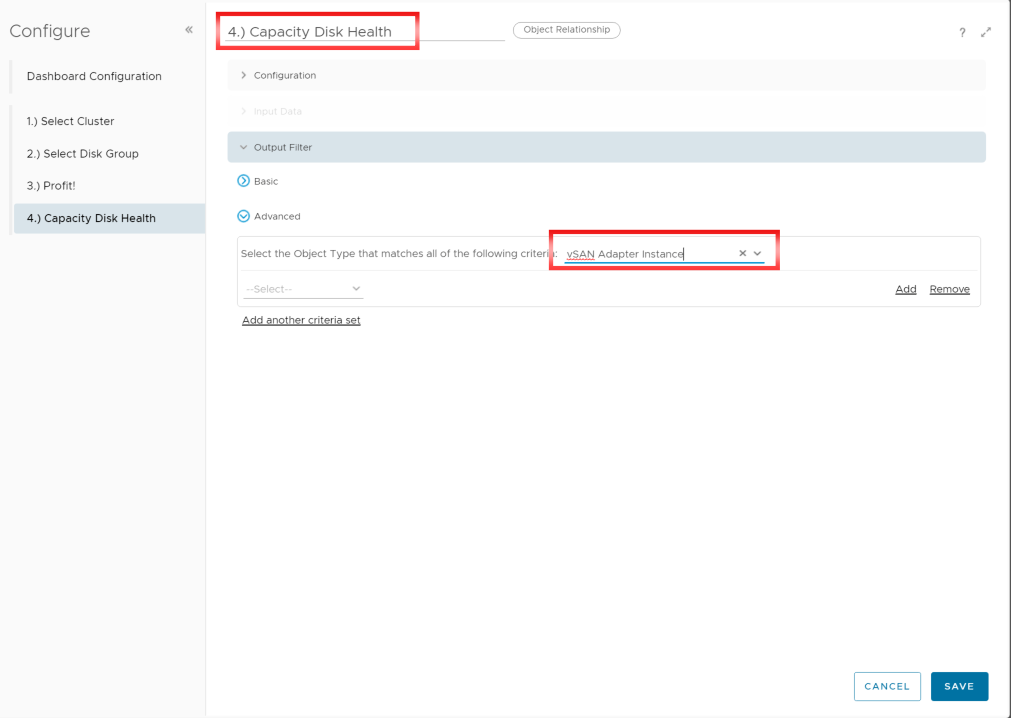
โดยเมื่อเราทำการเลือก Cluster จาก Object list จำนวน vSAN disk group ทั้งหมดจากใน Cluster ที่เราเลือกจะไปแสดงผลที่ Heat map. ที่ Heat map จะแสดงผลเป็น Blocks size ตามชนาดความจุของ แต่ละ disk group และ Color ก็จะแสดงผลจากค่า Average write latency in milliseconds. เมื่อเราทำการ เลือก Disk group จาก Heat map แล้ว ค่า Performance metrics ทั้งหมด ก็จะแสดงผลใน Scroeboard รวมถึง Capacity Disk Health ก็จะแสดงผลค่า Object relationship ด้วย.
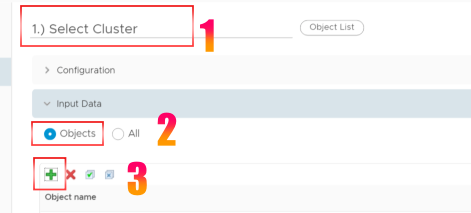
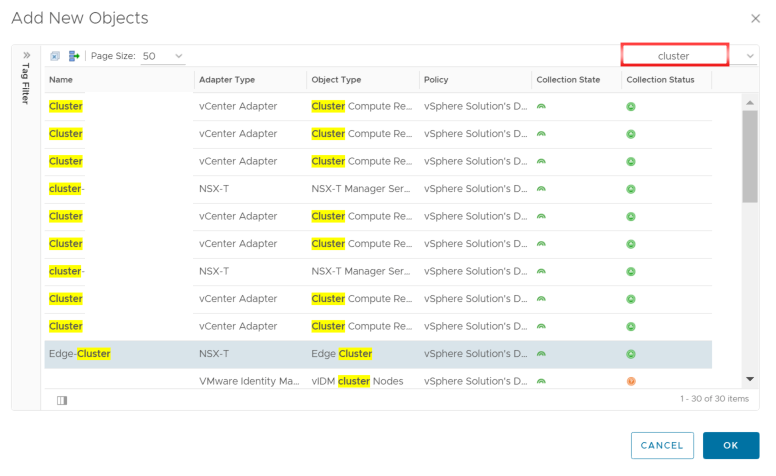
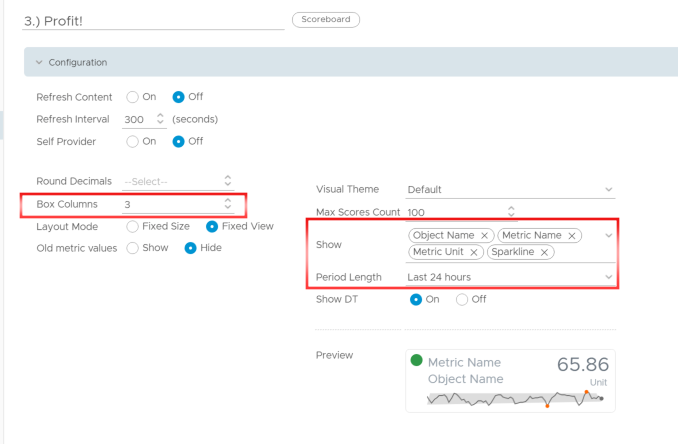
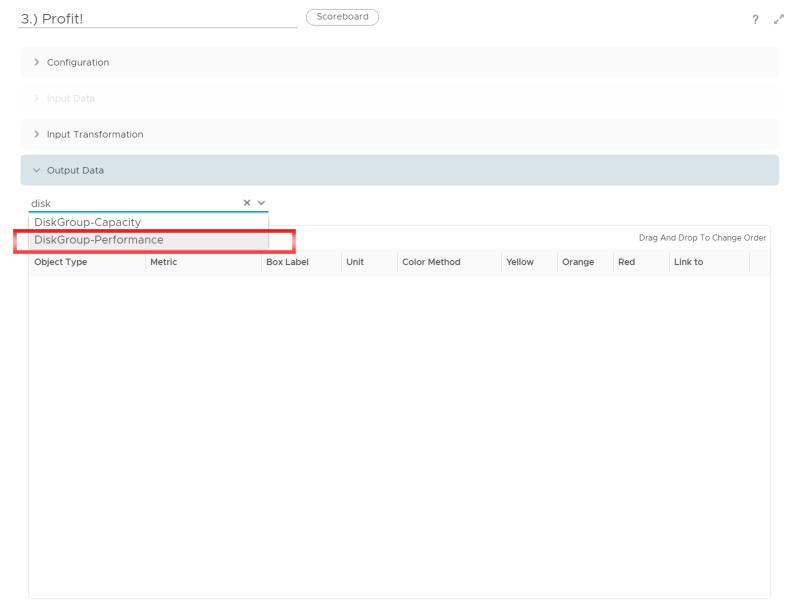
เมื่อเราทำการ Select Cluster ในช่อง 1.) Select Cluster ก็จะแสดง disk group ในช่อง 2. ) Select Disk Group และเมื่อเราทำการ click เลือก disk group ก็จะแสดงค่า Write / Read / IOP ต่างๆใน 3.) Profit! รวมถึง แสดงค่า Capacity Disk Healt ใน 4.) Capacity Disk Health
!!!หวังว่าคงเป็นประโยชน์ ในการ Monitor vSAN Disk group นะครับ!!!
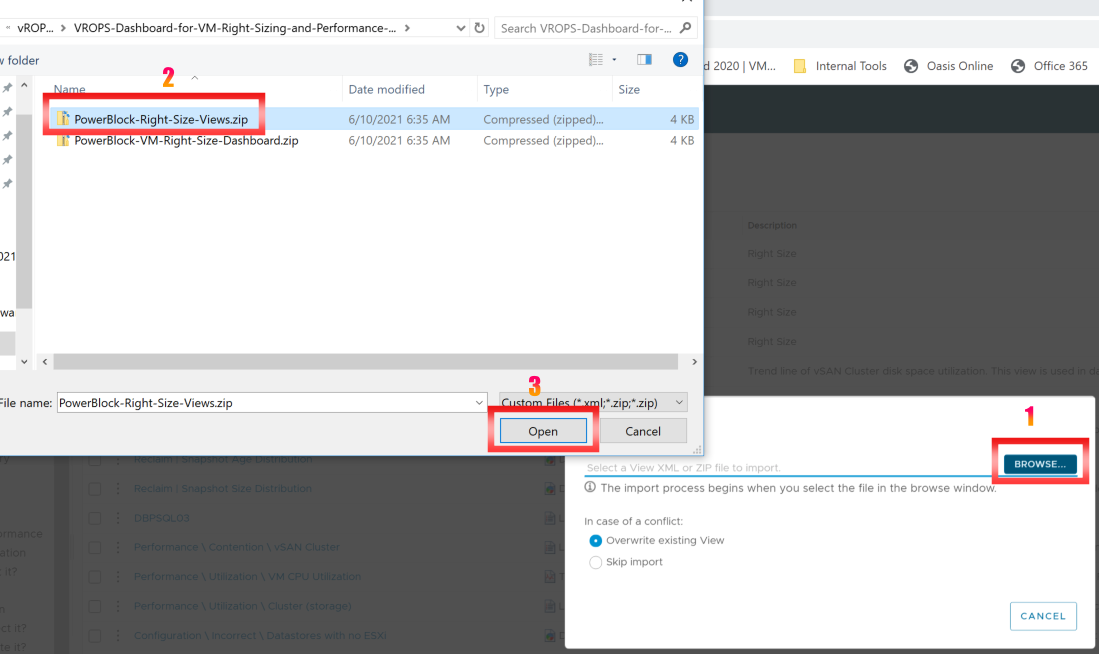
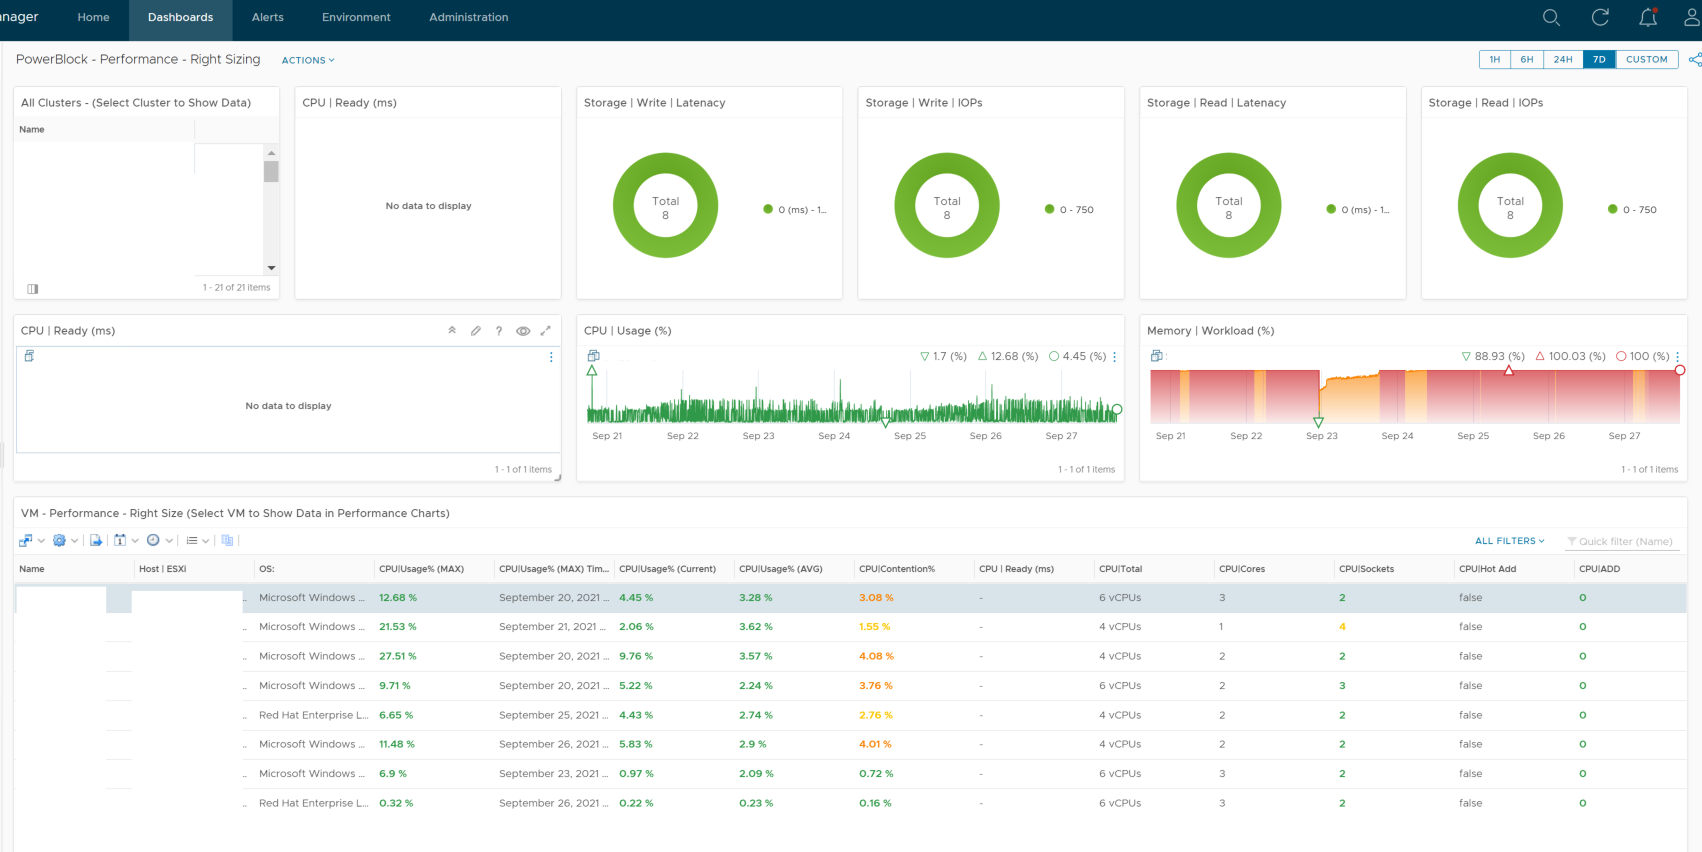
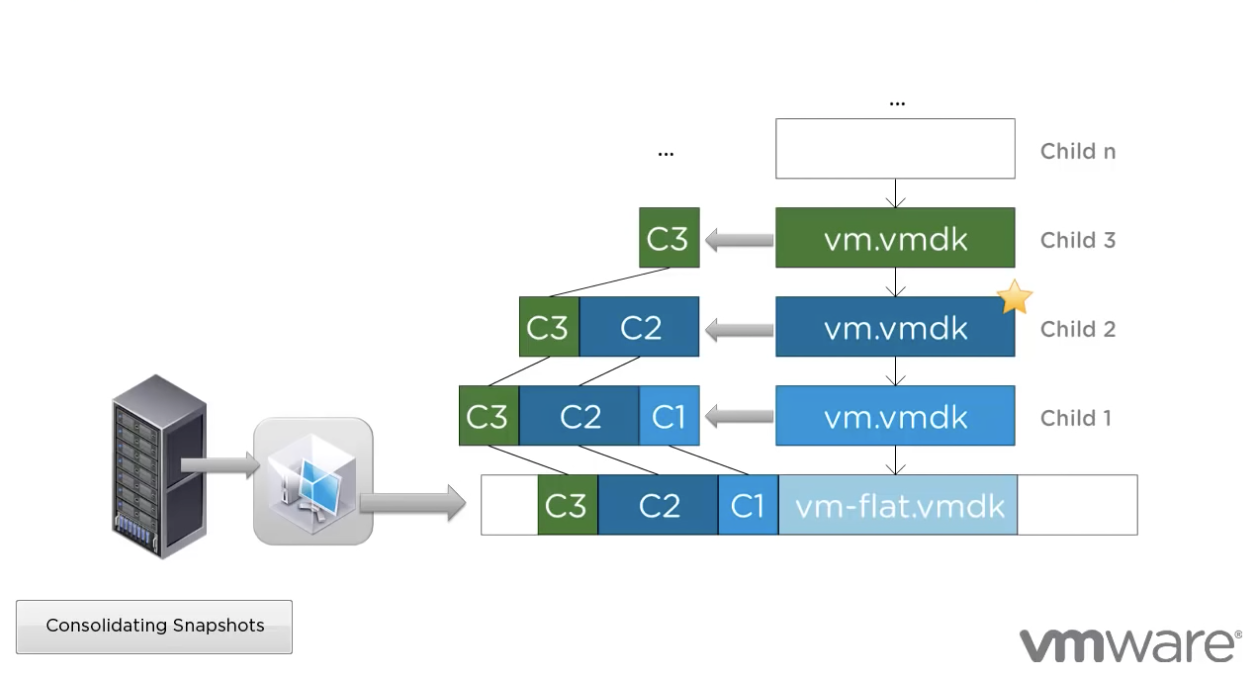
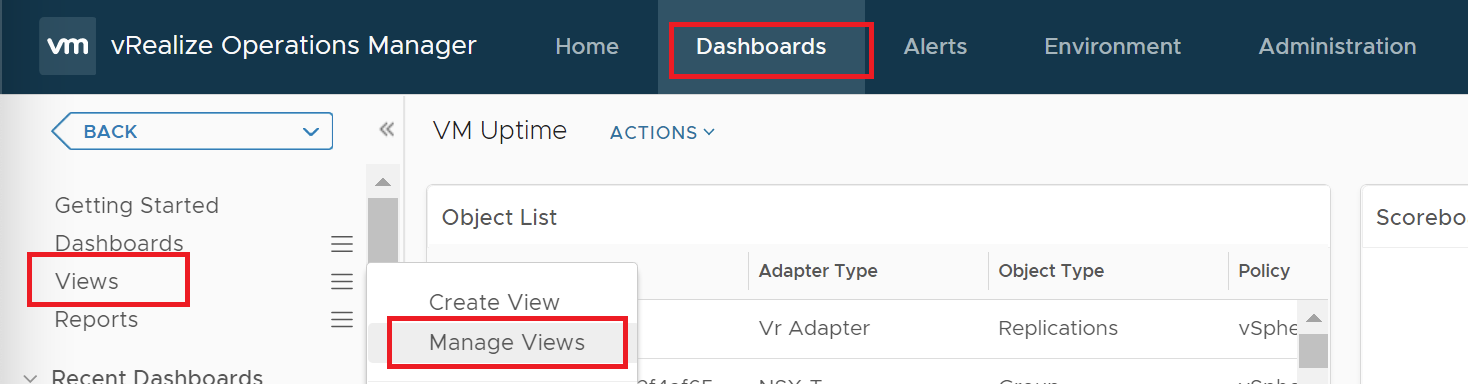
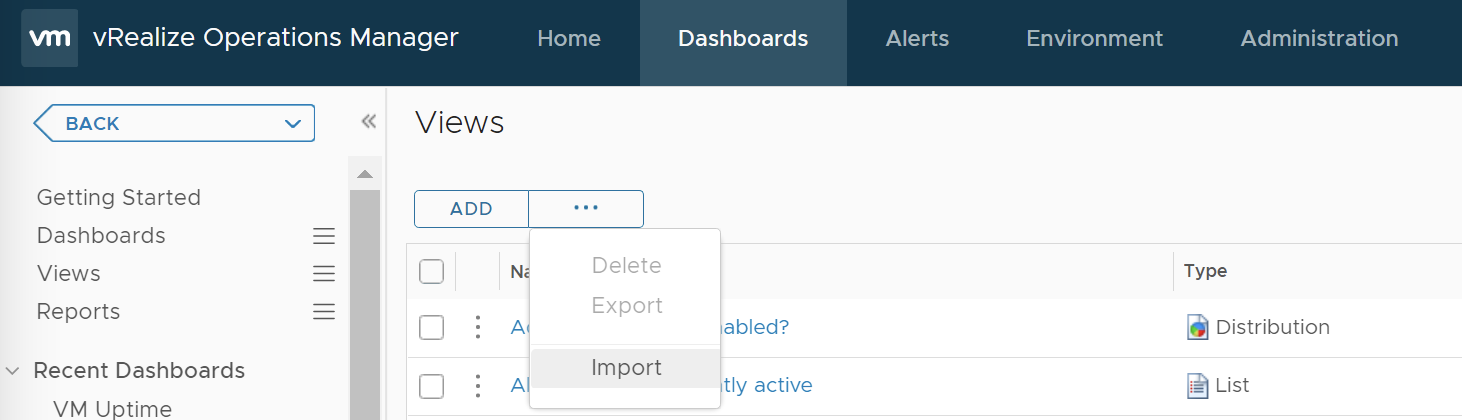
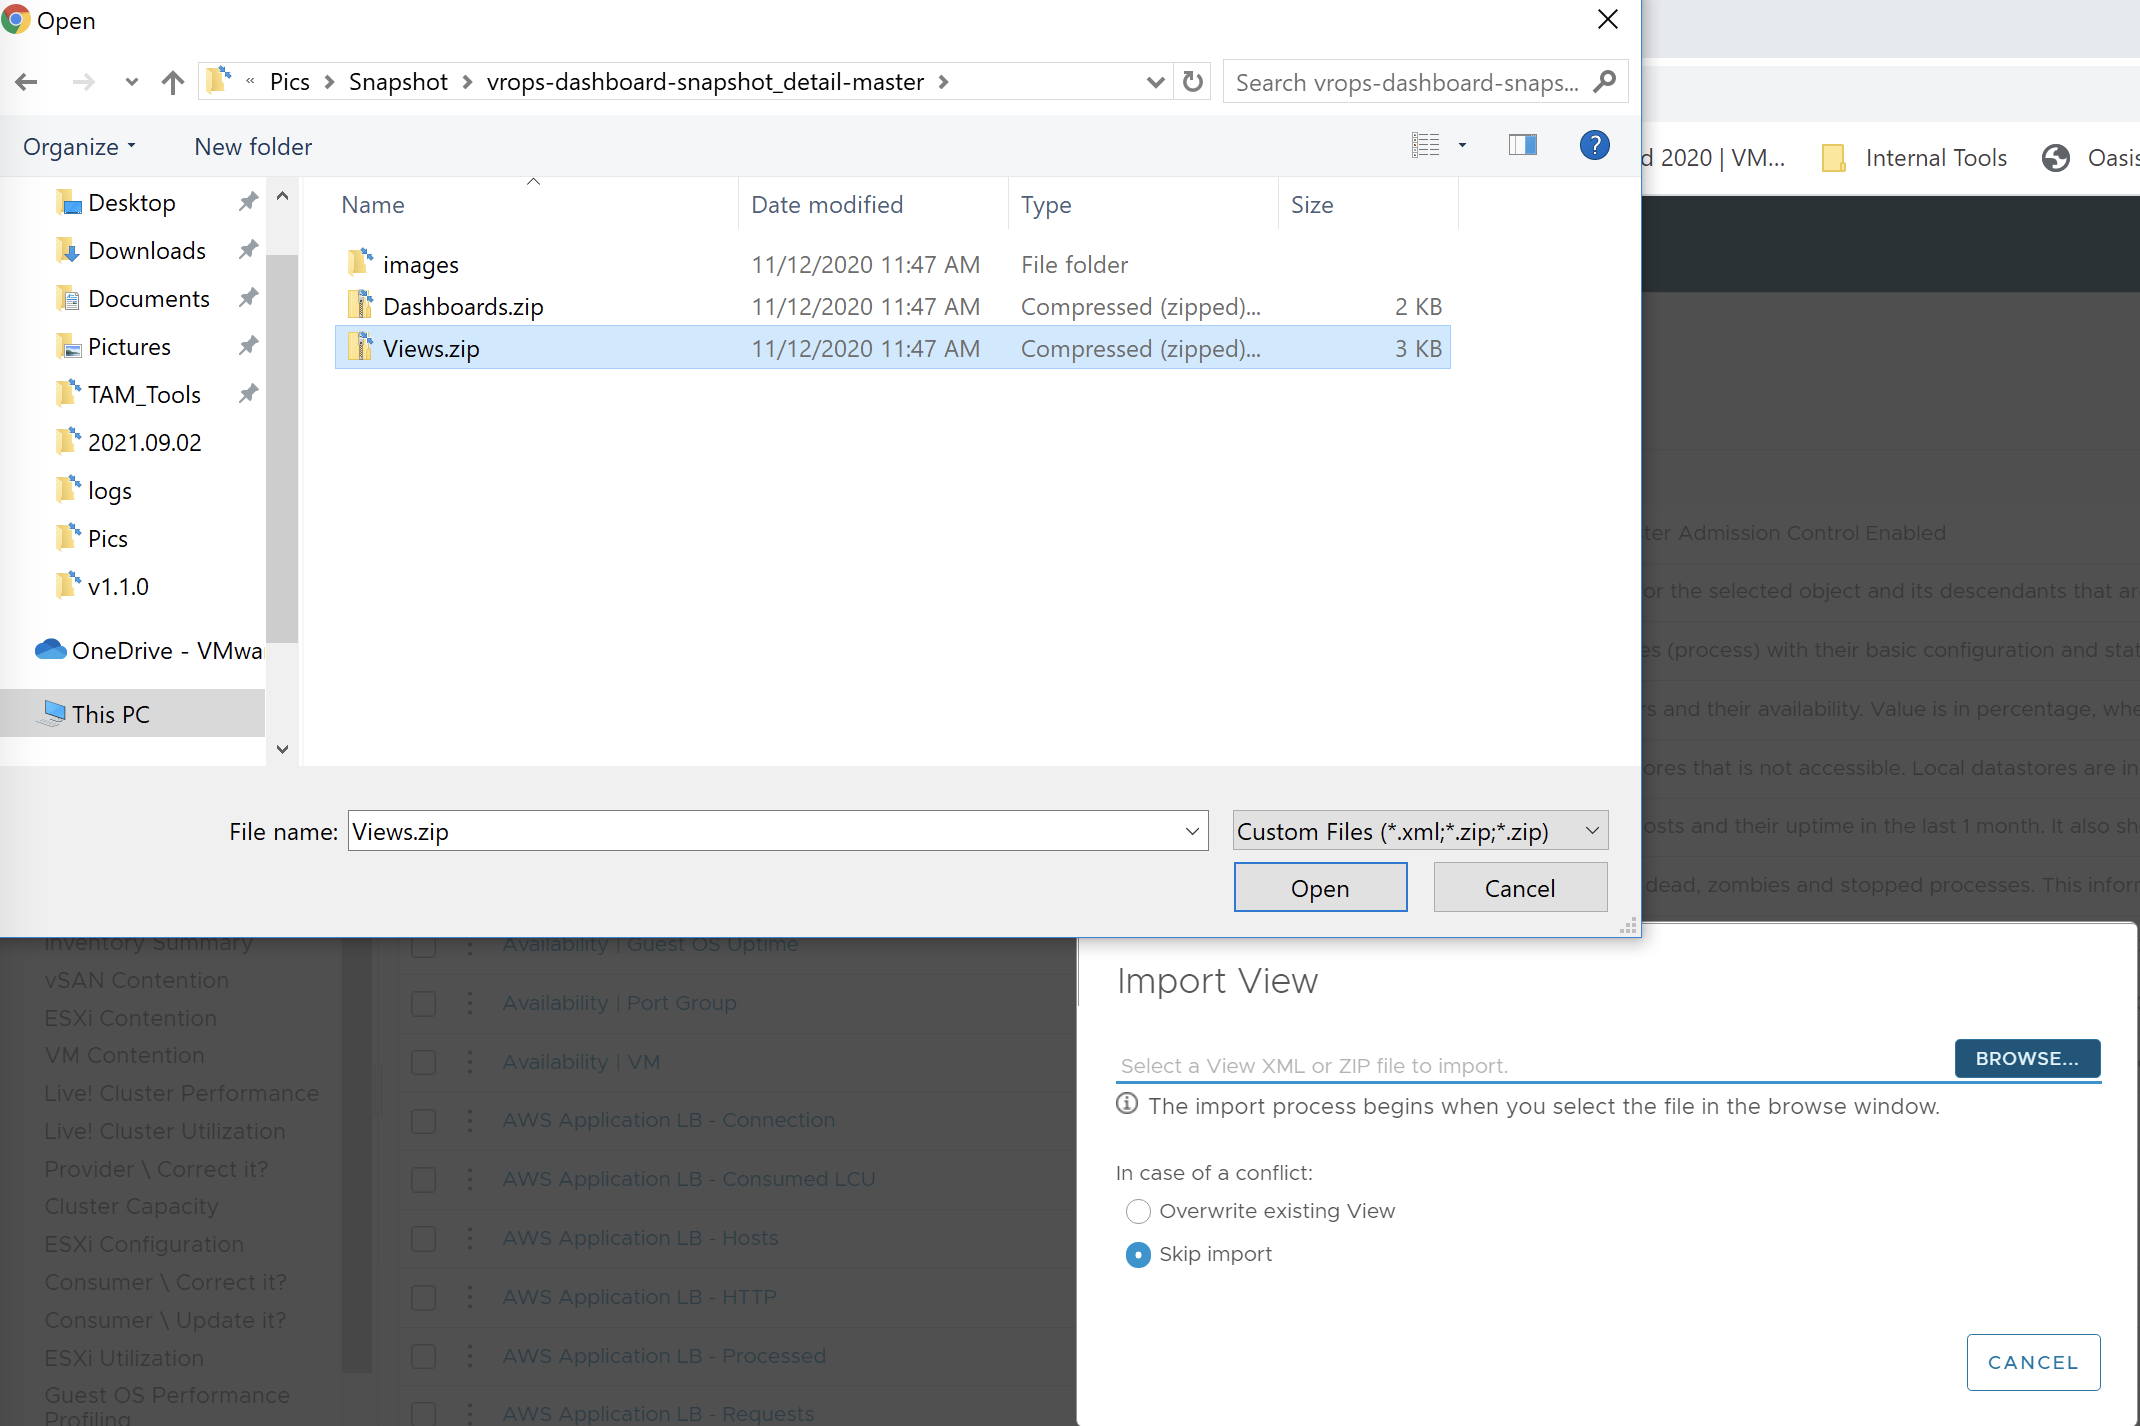
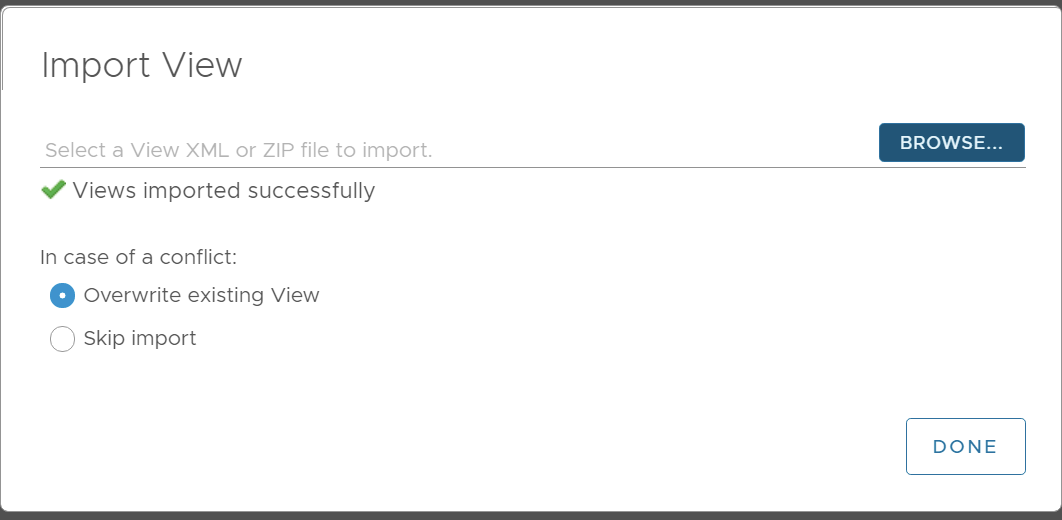
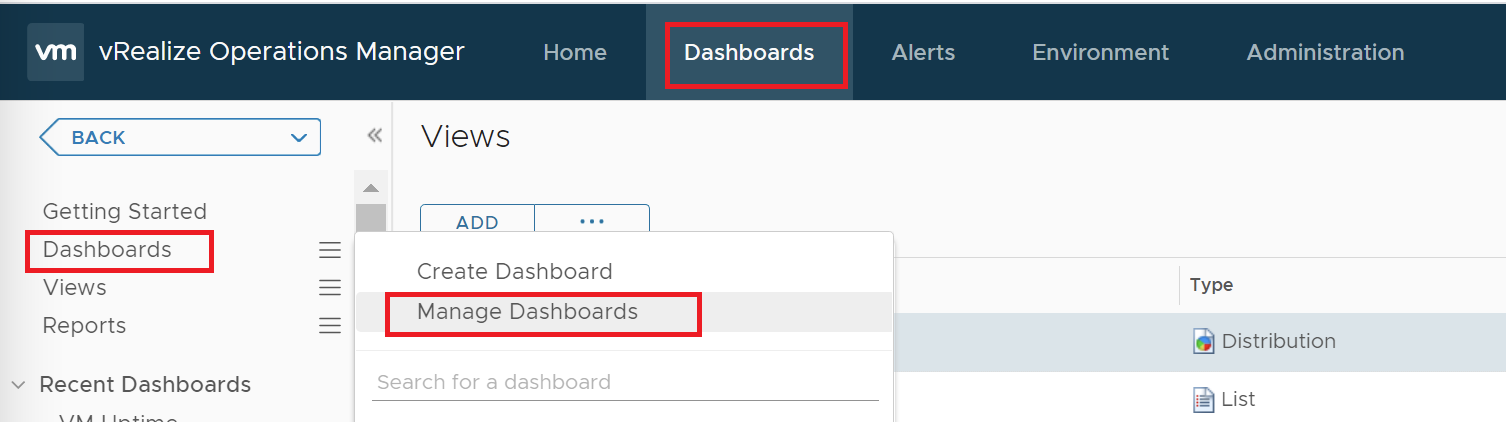
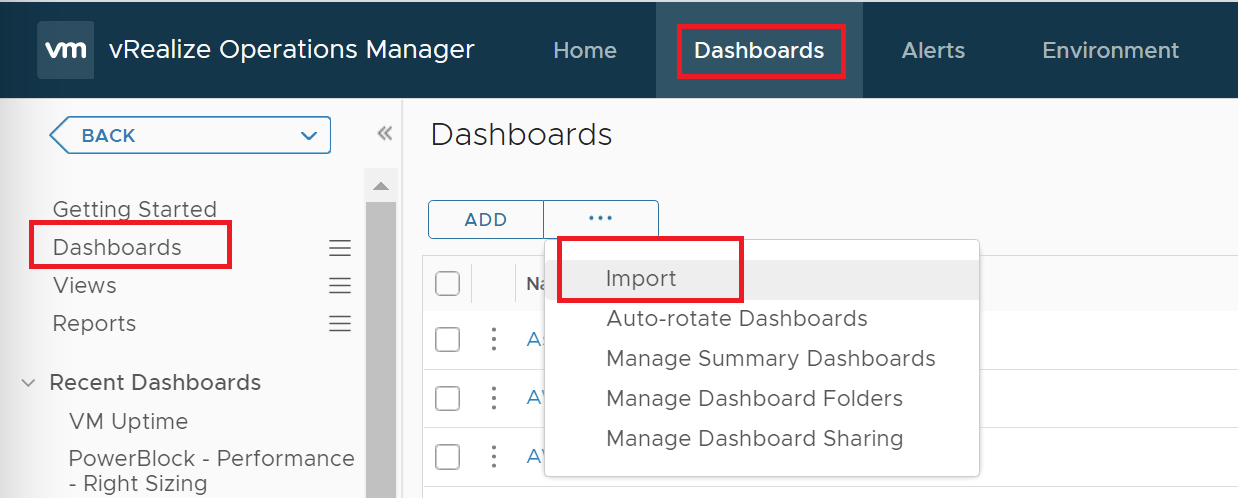
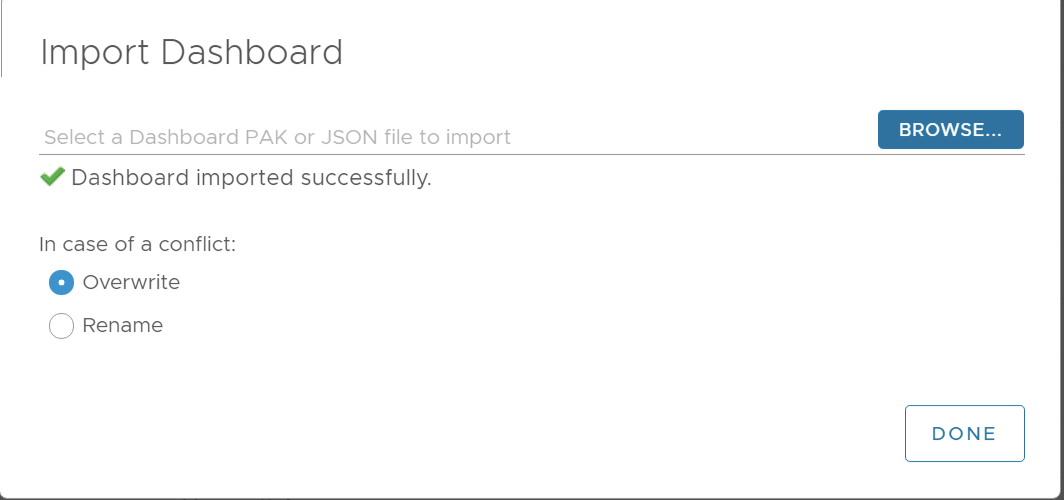
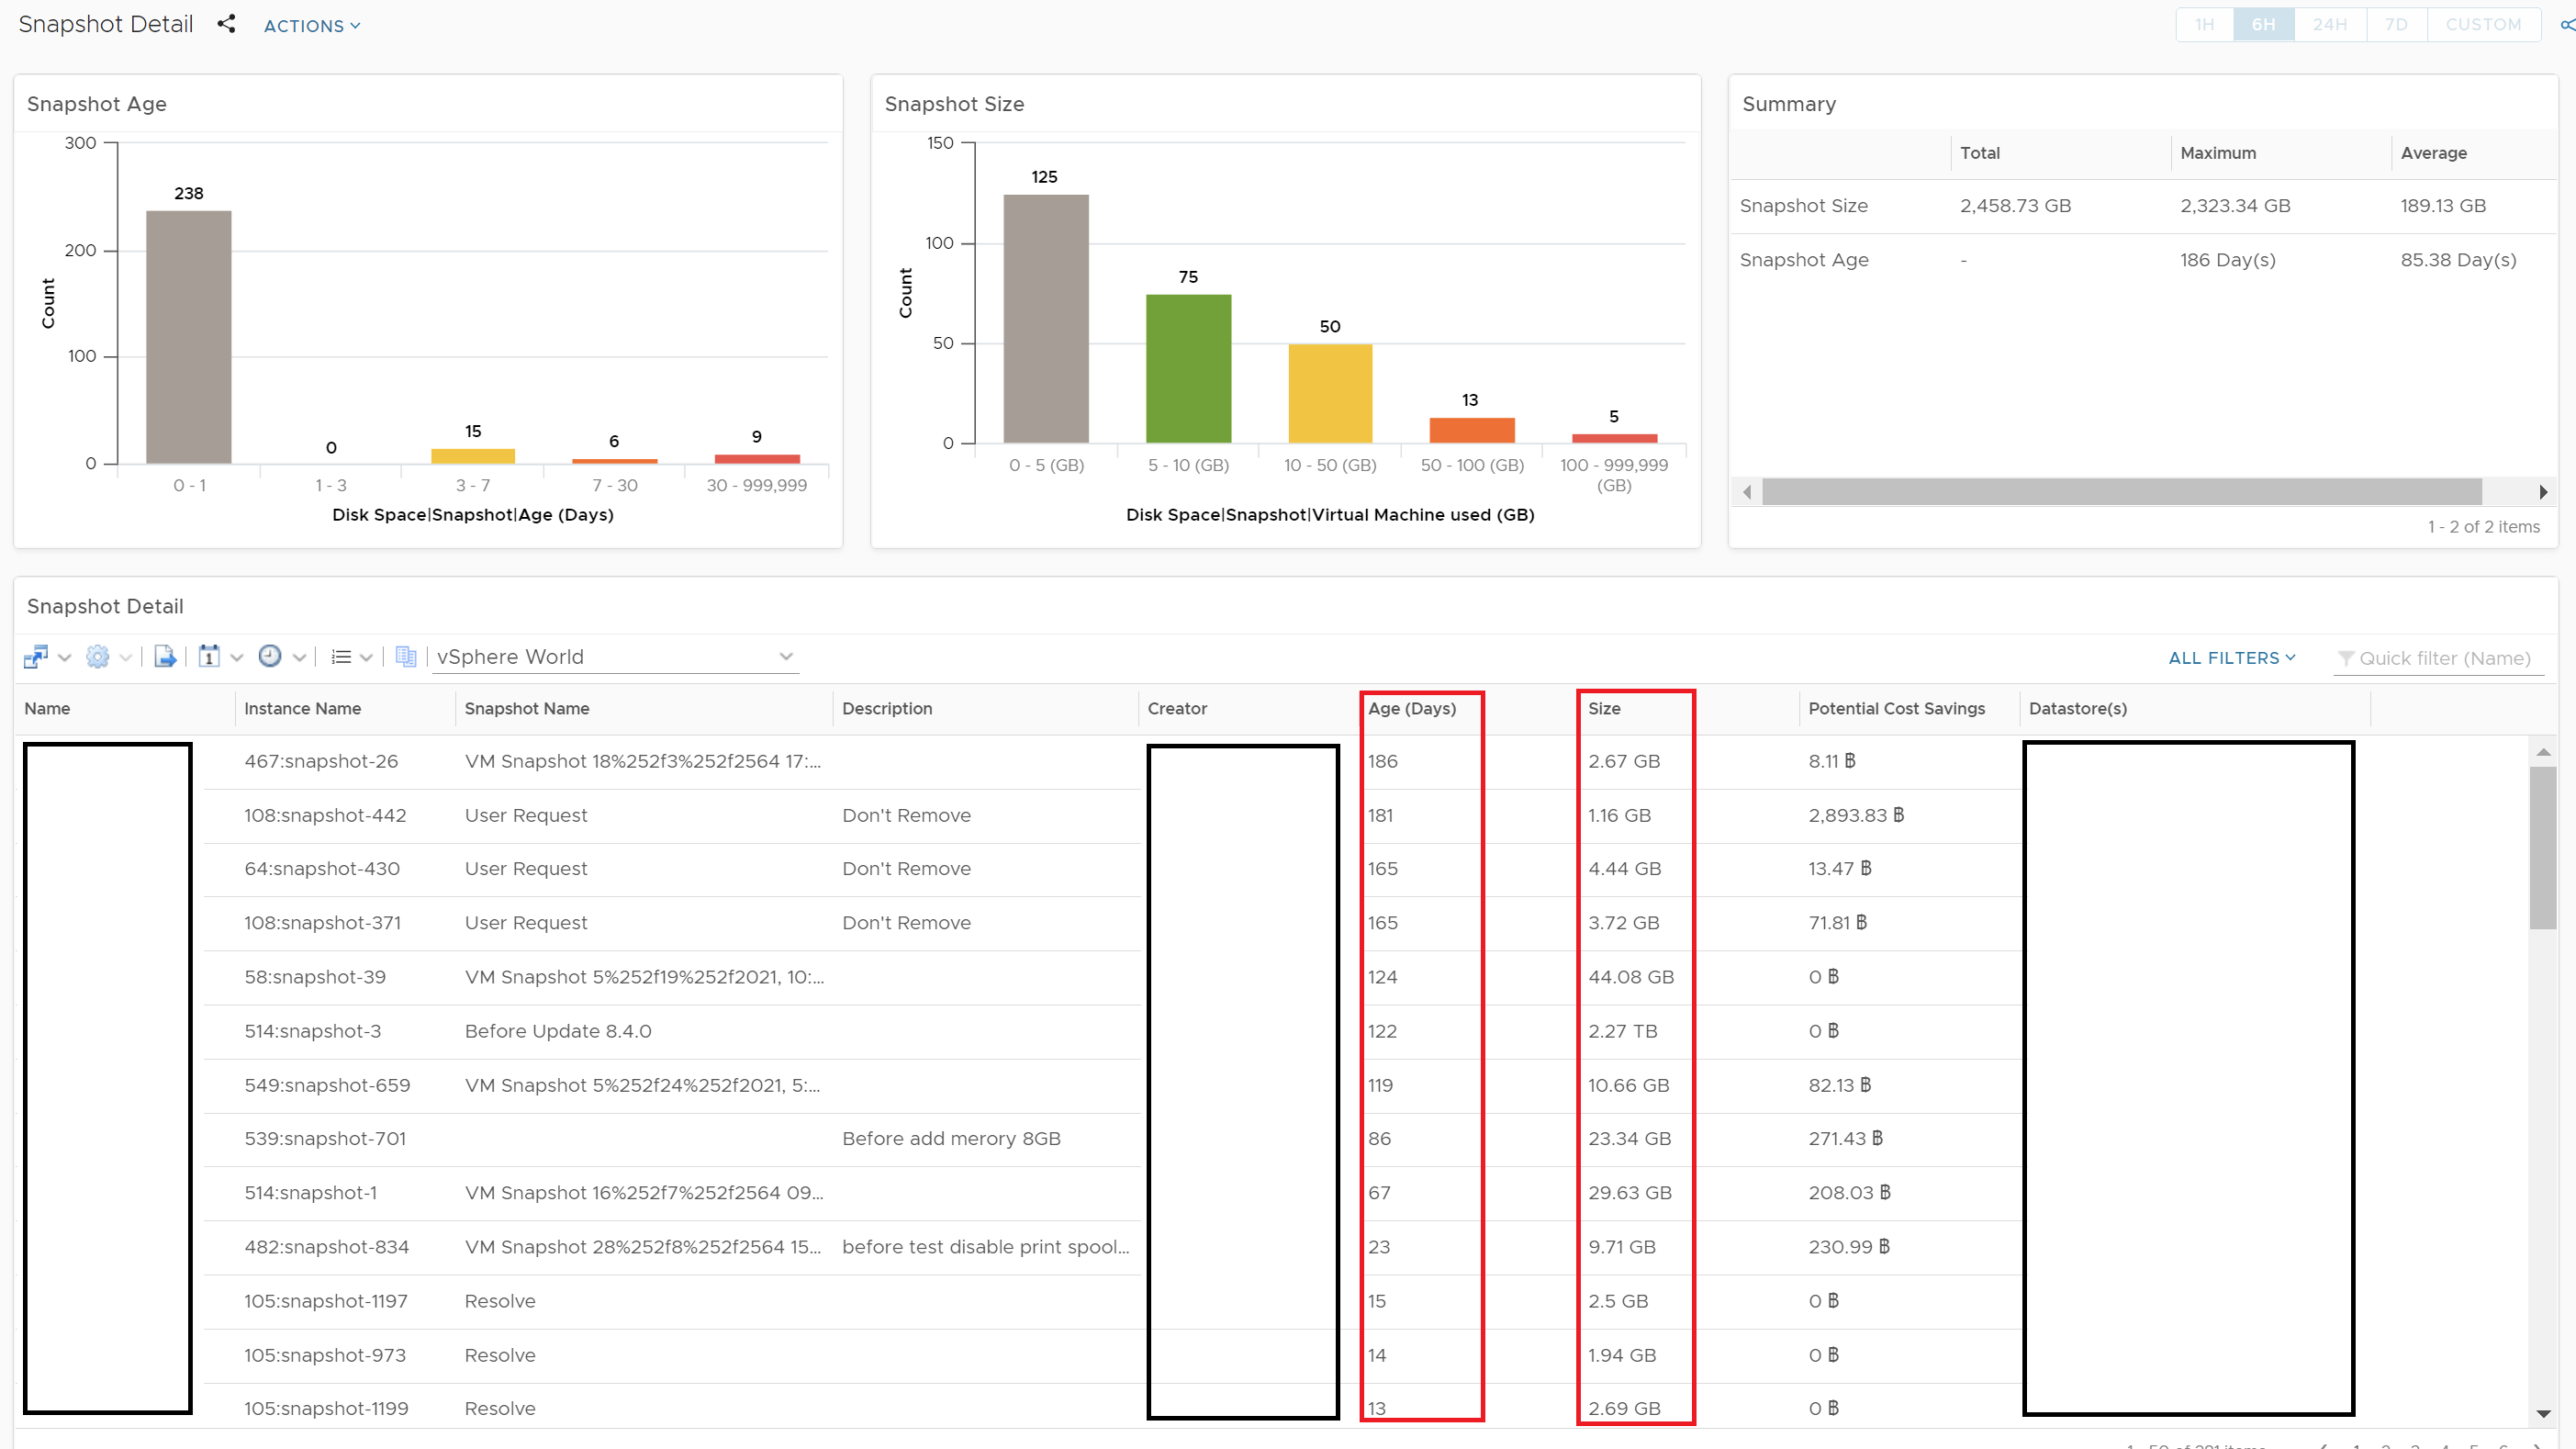
Dashboard Name: Snapshot Detail Dashboard Path: Shared Dashboards (GBrandon)/Troubleshooting Views View Name Name on Dashboard View Type Reclaim | Snapshot Age Distribution Snapshot Age Distribution Reclaim | Snapshot Size Distribution Snapshot Size Distribution Reclaim | Snapshot Summary Summary List Reclaim | Snapshot Detail Snapshot Detail List
Support
This dashboard requires vRealize Operation 8.2 Advanced or Enterprise edition or vRealize Operations Cloud.
A version compatible with vRealize Operations 6.7, 7.0, 7.5, 8.0, and 8.1 is available here.