By Lerpong Intaraworrapath | September 29th, 2021
Part 2 – วิธีการสร้าง Report หลังจาก ที่เรา create vROPs Dashboard สำหรับแสดงค่า Performace และ Right-Sizing ของ Virtual Machine
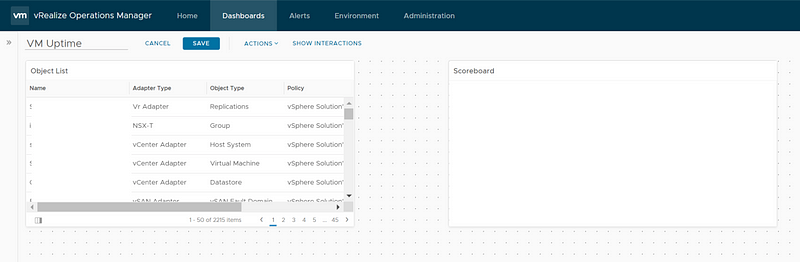
หลังจากที่เรา สร้าง Dashboard ที่แสดงค่า Performance และ Right Sizing ที่ถูกต้องของ CPU และ Memory ในการทำงาน ของ virtual Machine เรียบร้อยแล้ว เราก็จะมาทำการสร้าง Report กัน.
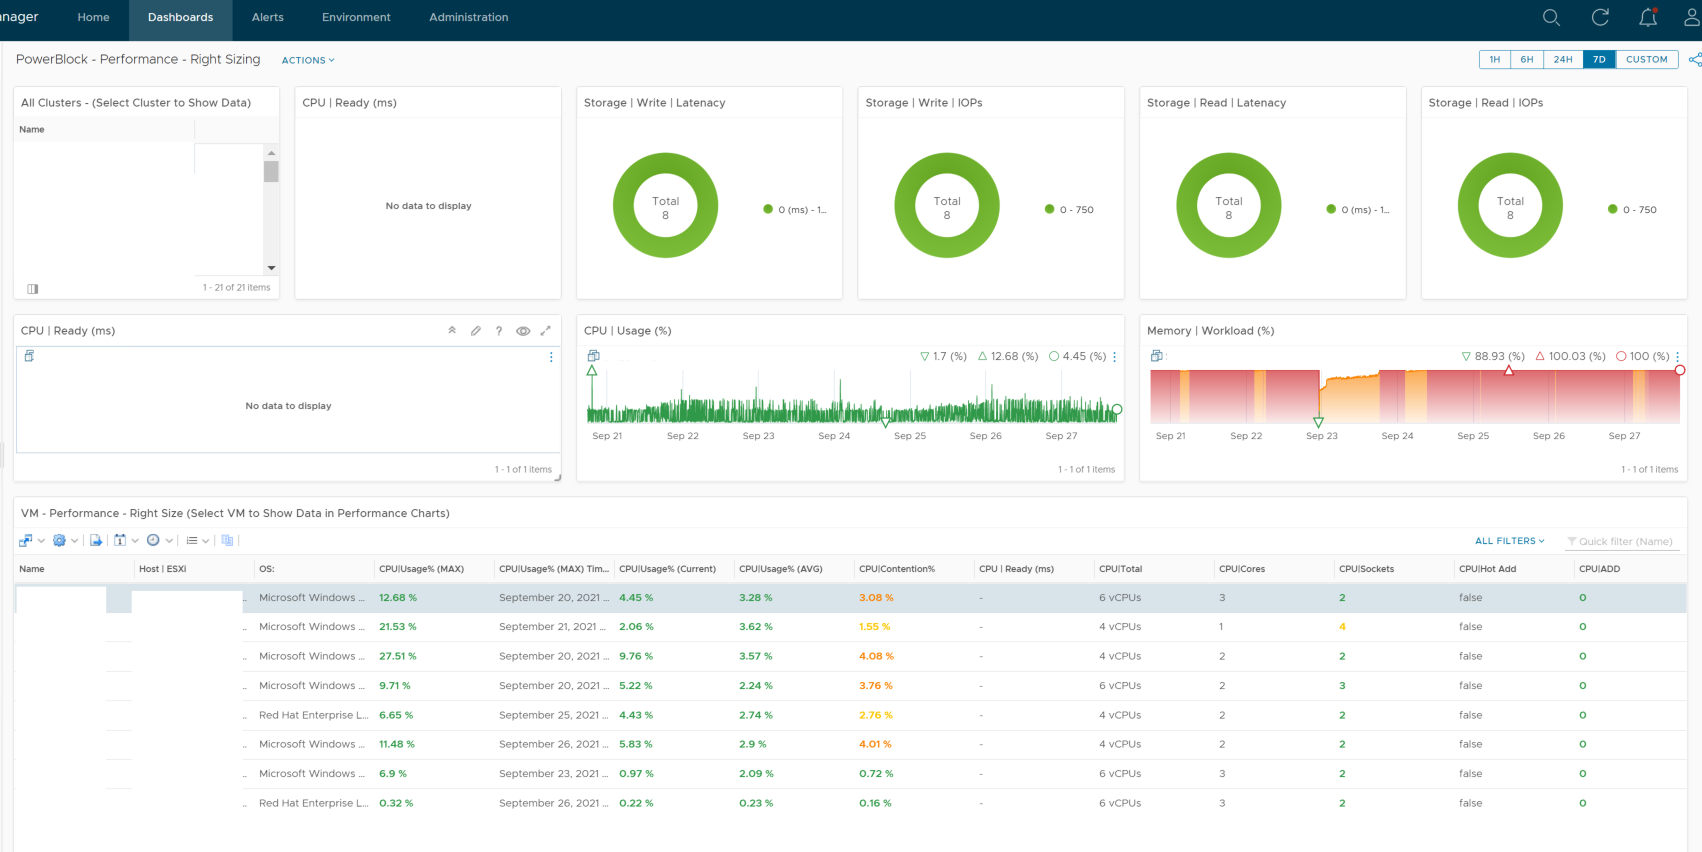
Part 1 – Create Dashboard vROPs Dashboard for VM Right-Sizing and Performance…Part 1
เริ่มขั้นการสร้าง Report
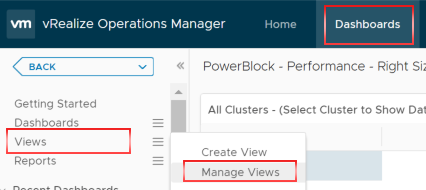
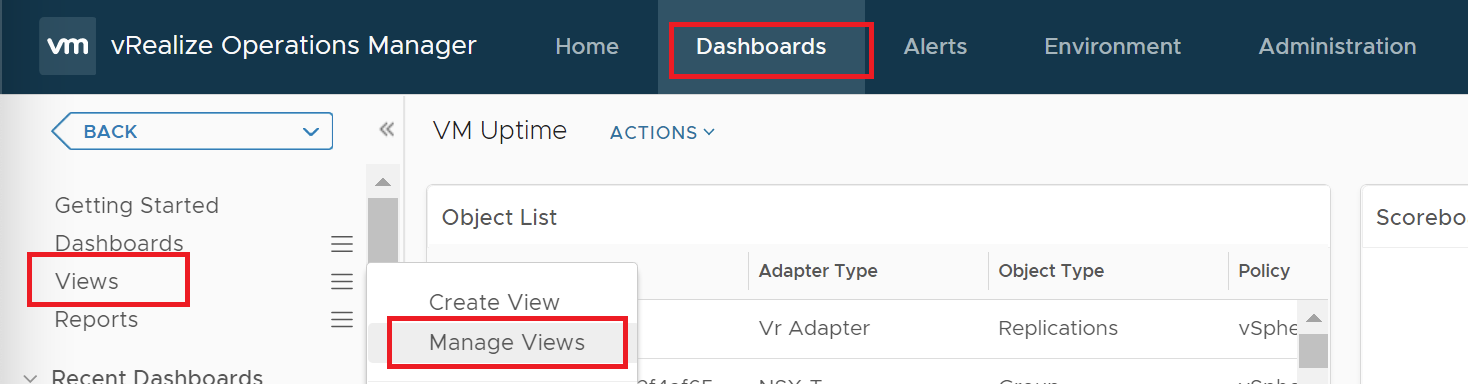
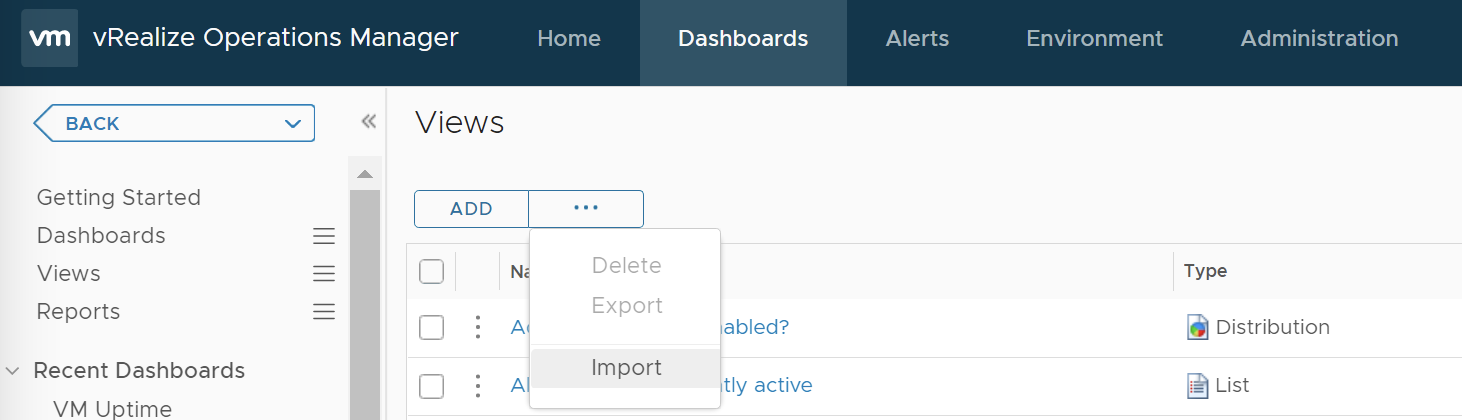
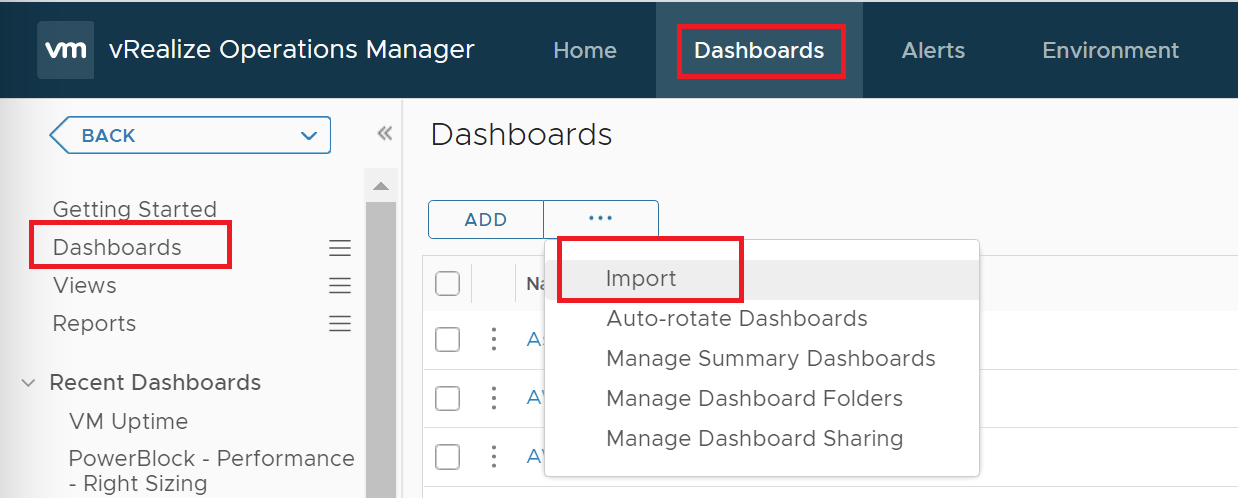
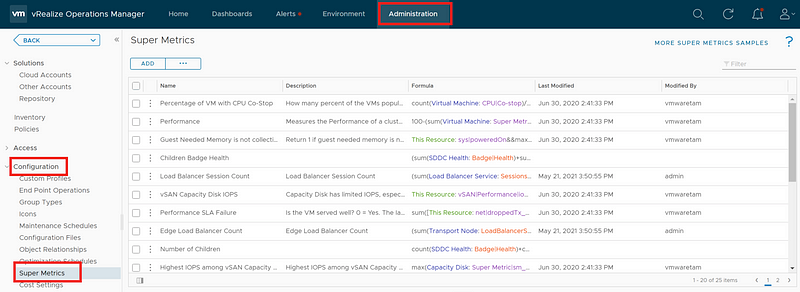
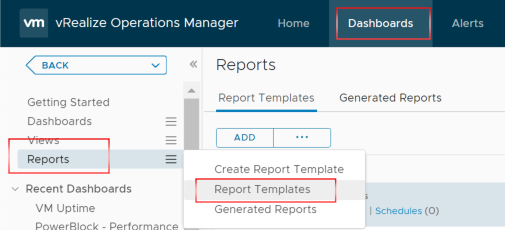
- ทำการ Login ไปที่ vRealize Operations Manager ไปที่ Tab Dashboard -> Reports -> Report Templates.
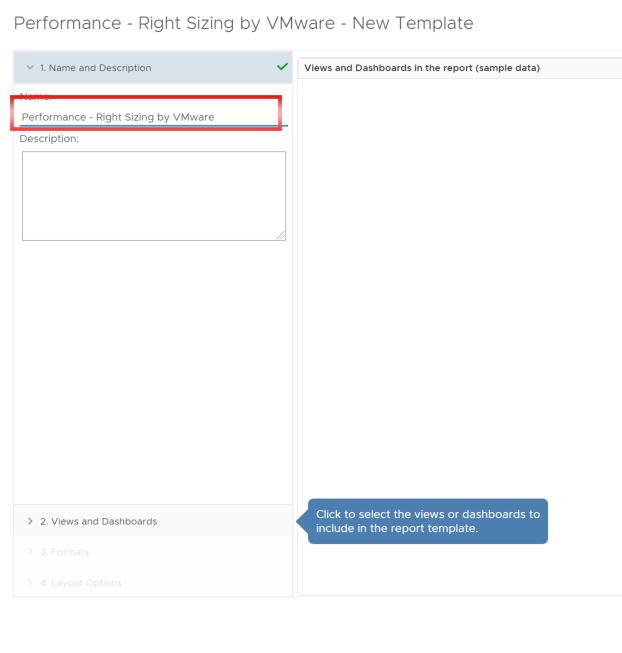
2. Click -> Add.
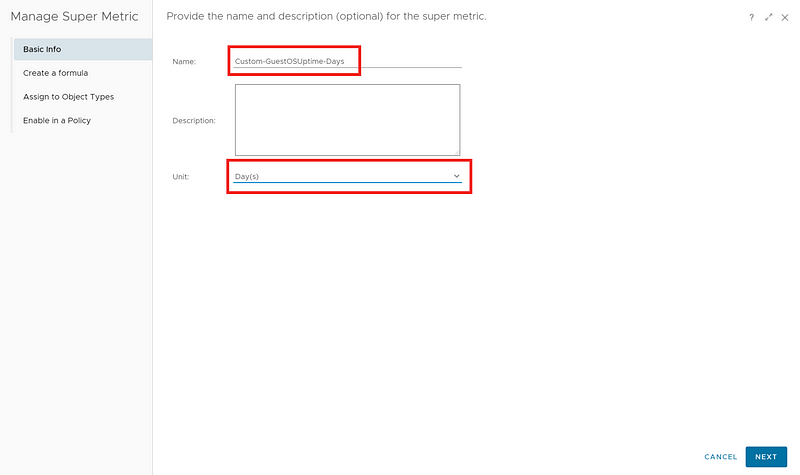
3. ใส่ชื่อ Report Name (ในที่นี้ผมจะใส่ ชื่อ “Performance – Right Sizing by VMware“).
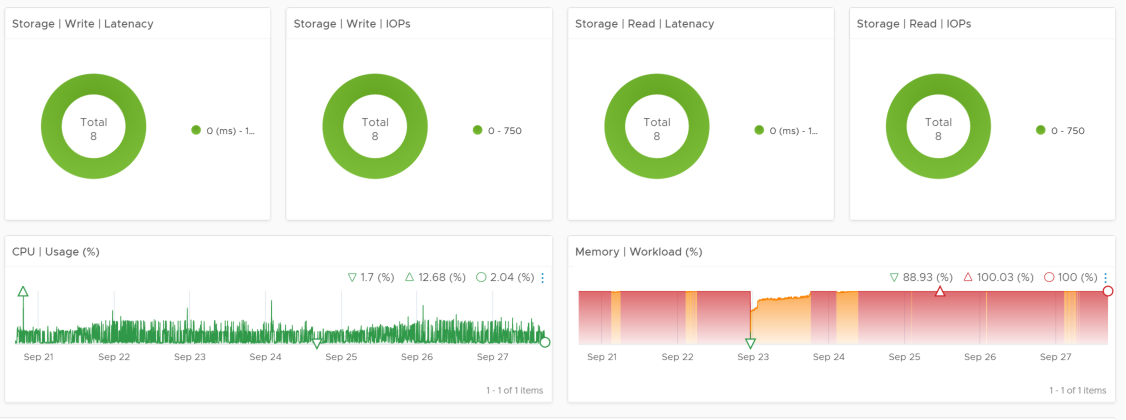
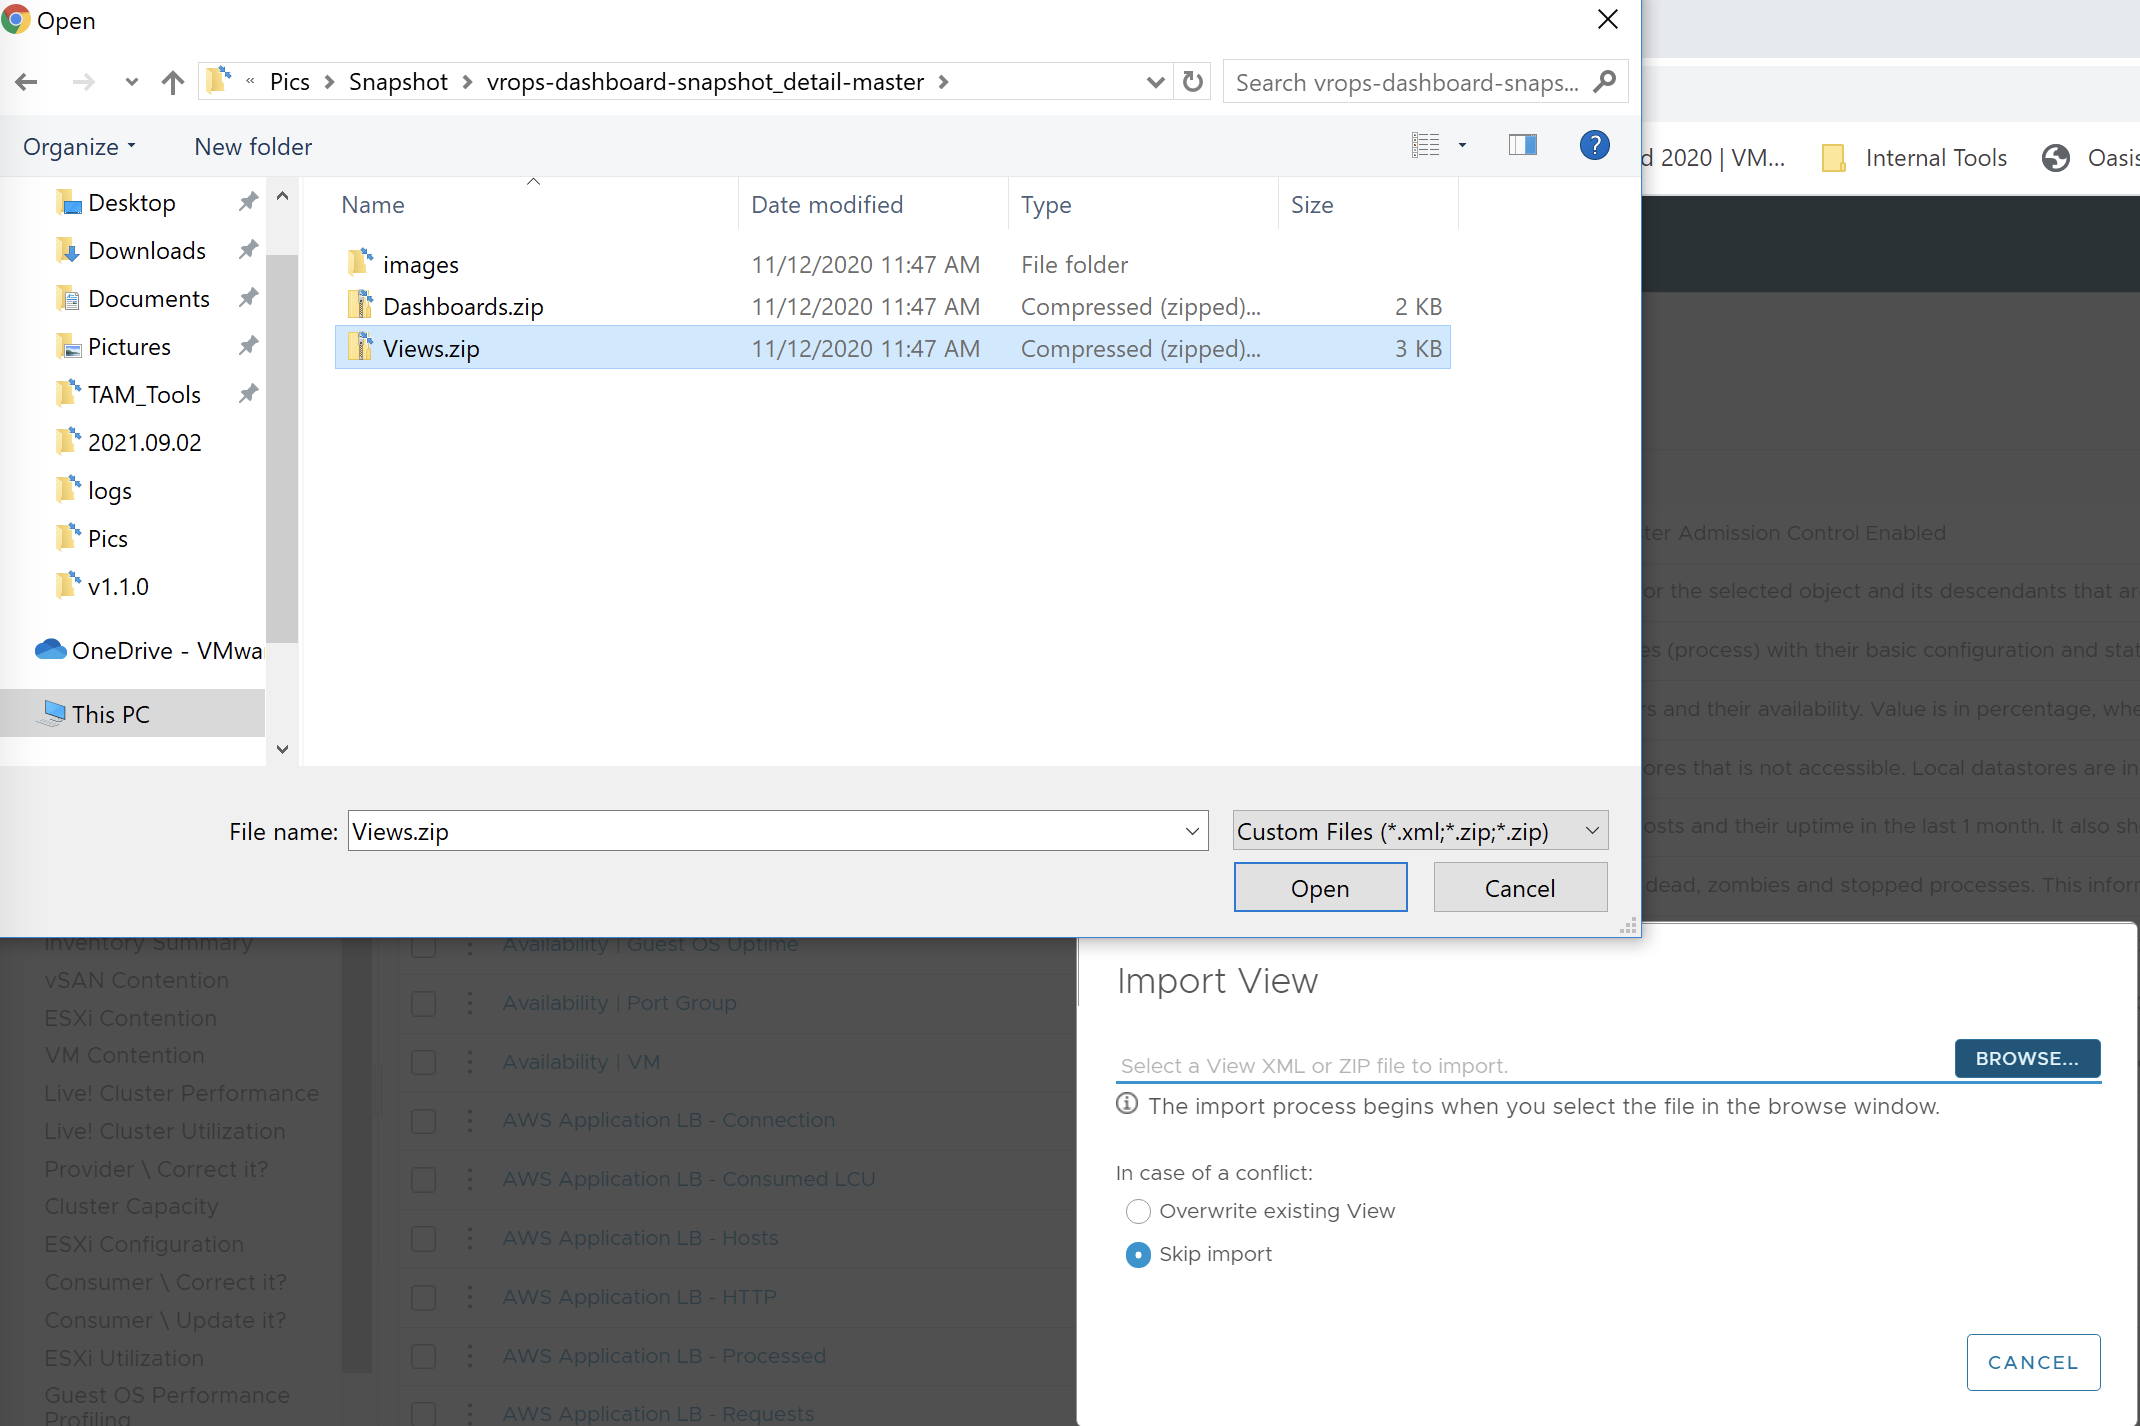
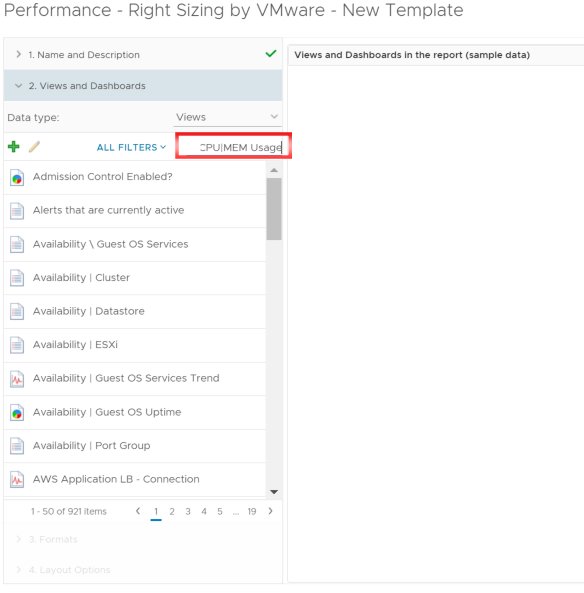
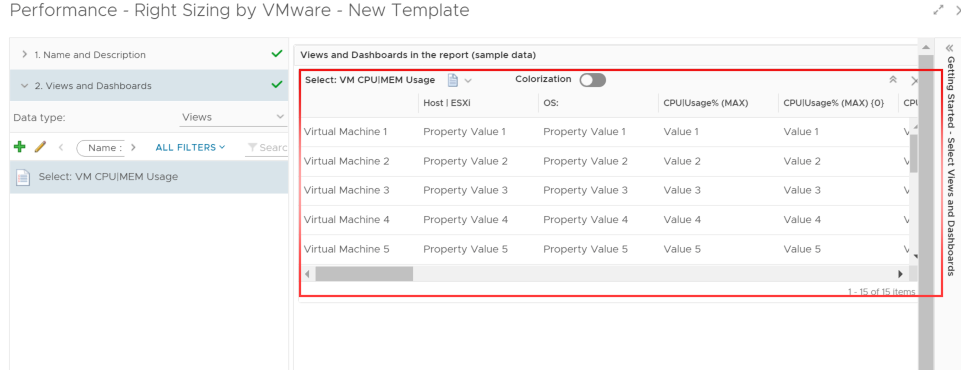
4. Select -> 2. Views and Dashboards / ตรงช่อง ALL FILTERS ให้พิมพ์ “CPU|MEM Usage” แล้วกด Enter.
5. เราก็จะได้ค่า Views ที่เราต้องการ ที่จะให้แสดงใน Report -> Select: VM CPU|MEM Usage.
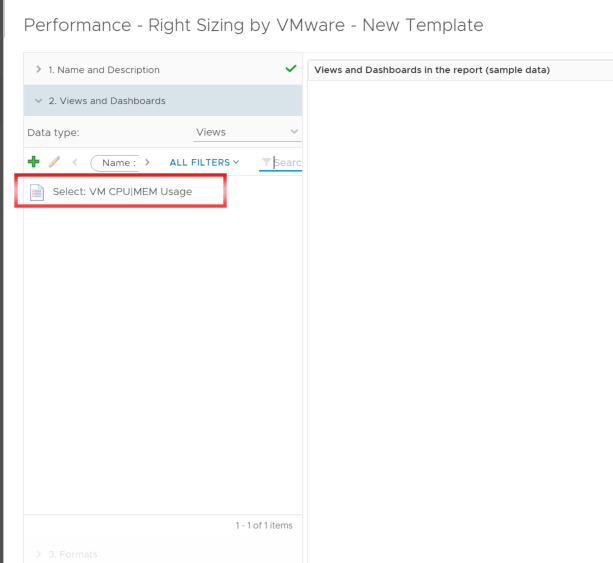
6. ทำการ Double click ค่า Views ที่เราเลือก.
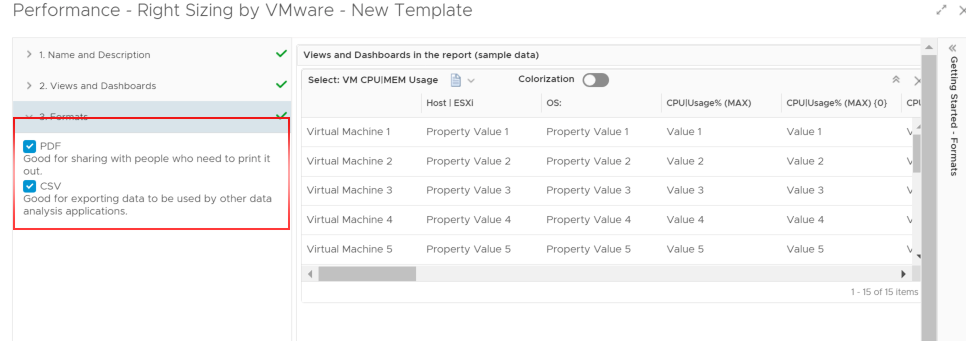
7. ทำการ เลือก รูปแบบของ Report ที่ต้องการ PDF หรือ CSV หรือทั้งสองแบบ.
8. เราสามารถจัดรูปแบบของ Cover Page, Table of contents หรือ Footer ได้ แต่ถ้าไม่ต้องการเปลี่ยนแปลงอะไรให้กด SAVE.
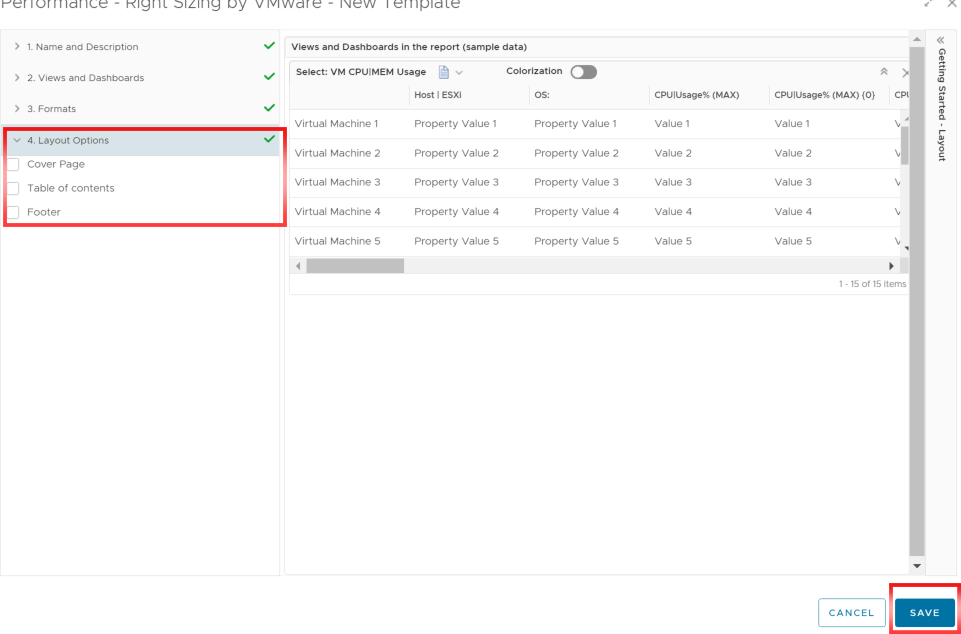
9. เราก็จะได้ Report “Performance – Right Sizing by VMware“.
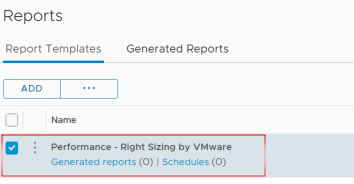
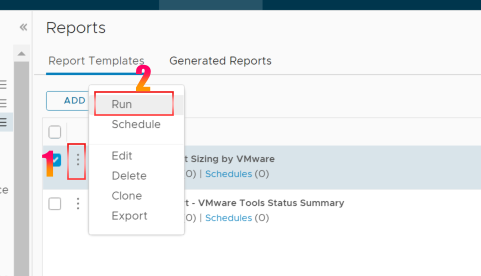
10. จากนี้เราจะ มาทำการ Run Report โดยทำการ Click ที่ 3 จุด จากนั้นเลือก Run.
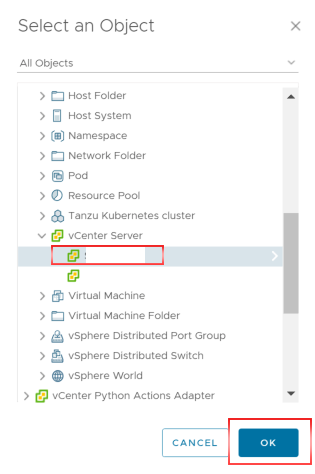
11. ทำการ Select an Object ที่ต้องการ (สามารถเลือก Object ที่เป็น Cluster, Folder, Host, etc ก็ได้)ในที่นี้ผมเลือก vCenter Server ทำเลือก vCenter Server ที่ต้องการ แล้ว Click OK.
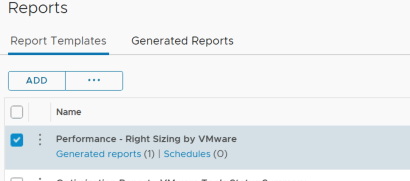
12. vROPs ก็จะทำการ Generated reports (เราจะสังเกต ในวงเล็บจะมีเลข 1).
13. ให้เราไป เลือกที่ Tab Generated Reports ทำการ Download report ที่ Generated ออกมา
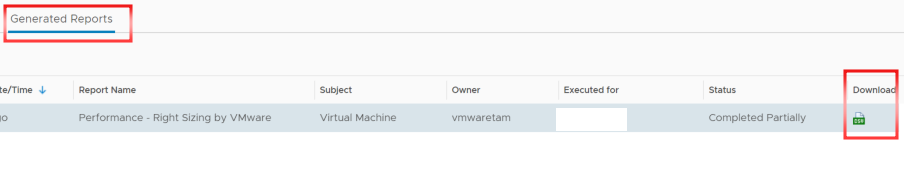
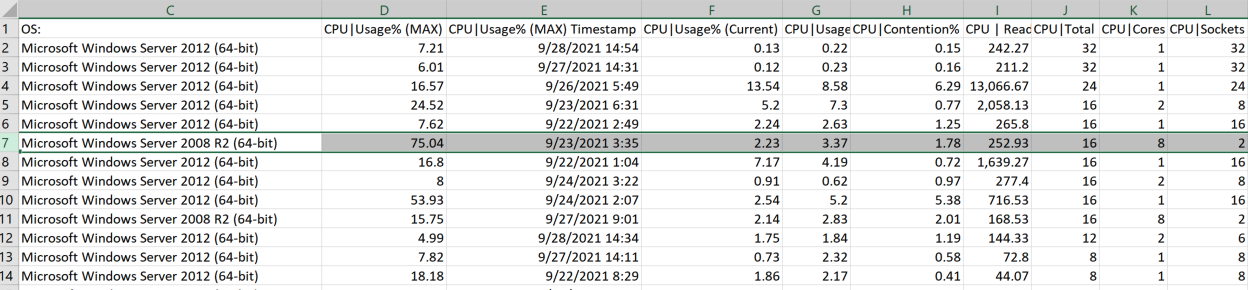
14. เราก็จะได้ Report CSV ไฟล์ นำไปใช้งานได้
!!!หวังว่าทุกคนจะสามารถ นำไปใช้ประโยชน์ ในการ Monitor System ที่ใช้งานอยู่นะครับ!!!