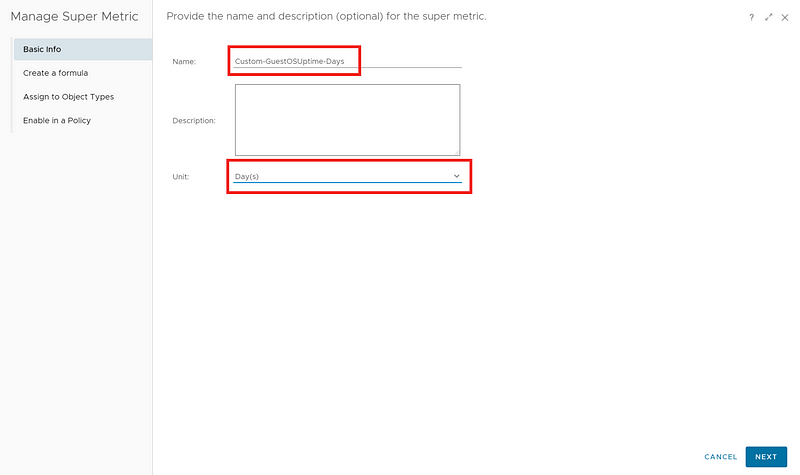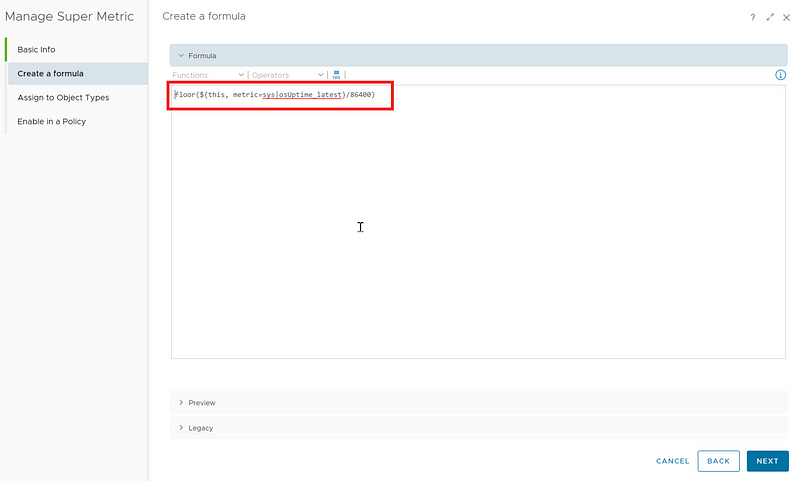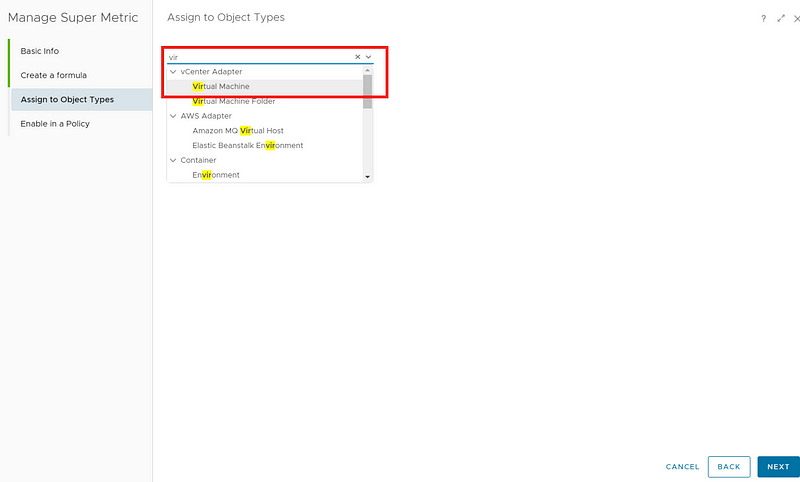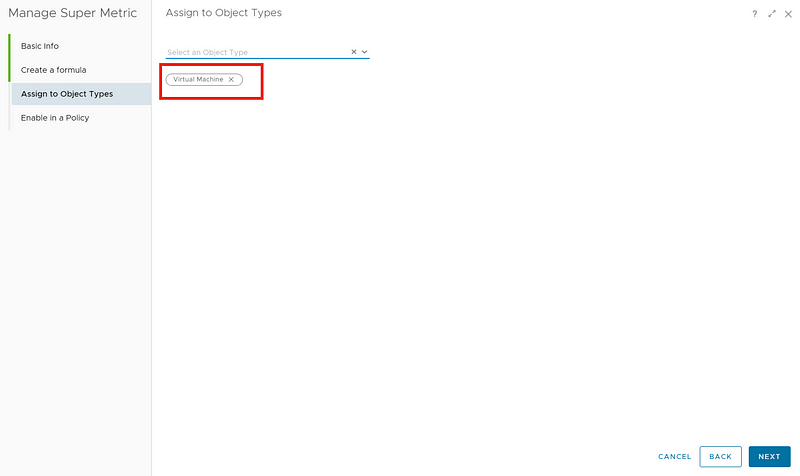
By Lerpong Intaraworrapath | September 28th, 2021
Part 1 – วิธีการสร้าง vROPs Dashboard สำหรับแสดงค่า Performace และ Right-Sizing ของ Virtual Machine
***ทำการ download Views และ Dashboards จาก link ด้านล่างมาเตรียมไว้ก่อนนะครับ
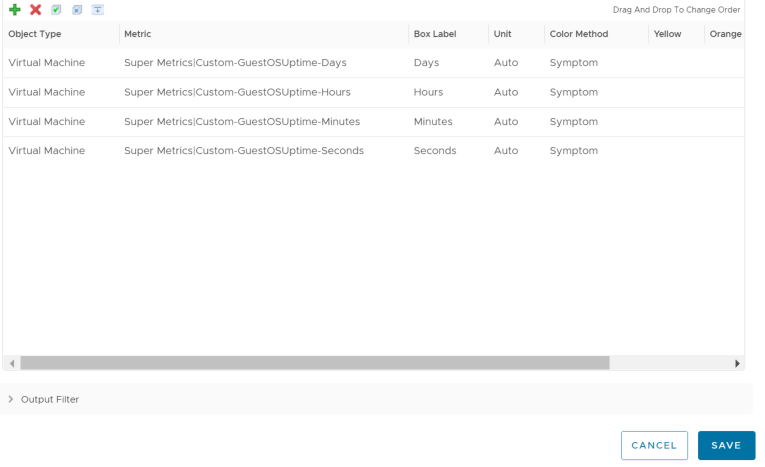
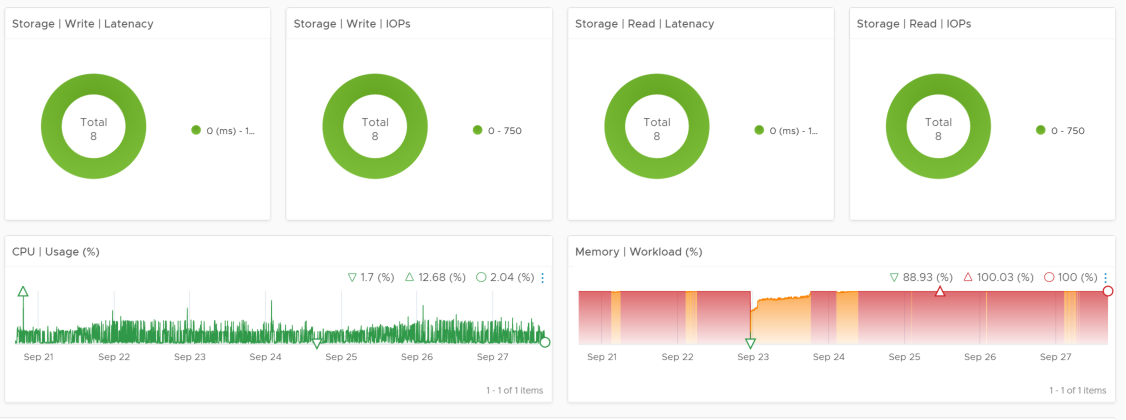
Dashboard ที่เราจะ create ขึ้นมาจะแสดงค่าที่ถูกต้องของ CPU และ Memory ในการทำงาน ของ virtual Machine จากการ monitor history การทำงาน รวมถึงแสดงค่าปัจจุบันของ CPU และ Memory ของ virtual Machine ที่กำลังใช้งานด้วย รวมทั้งแสดงค่า Metrics ที่จำเป็นในการ monitor virtual machine ด้วย.
เริ่มการติดตั้ง
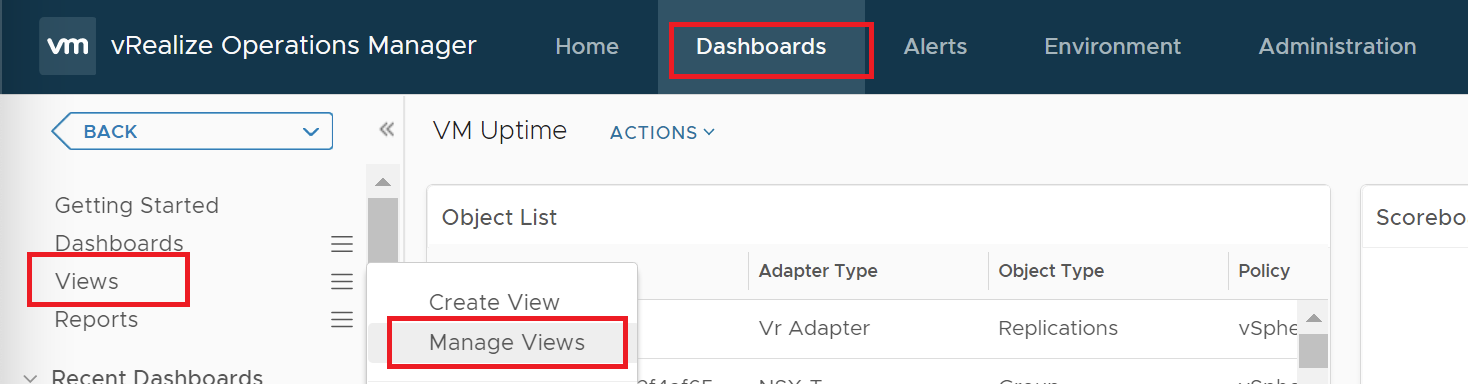
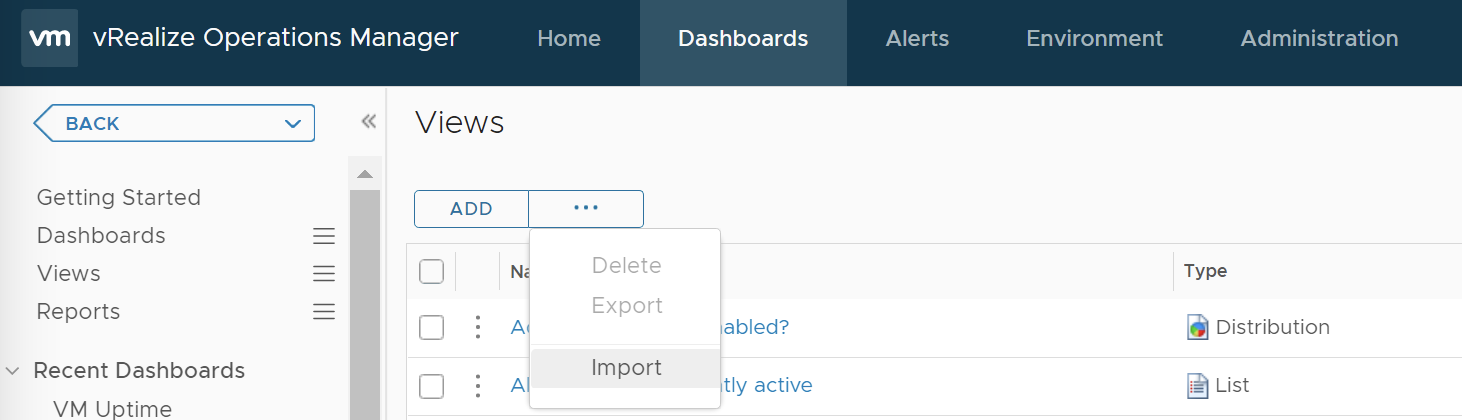
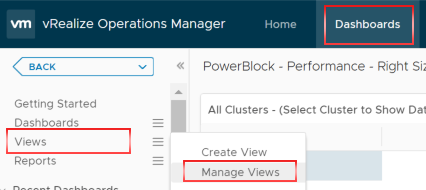
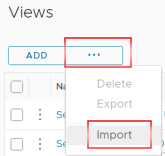
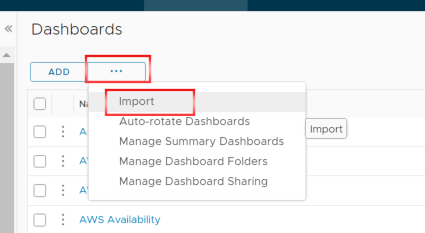
- ทำการ Login ไปที่ vRealize Operations Manager ไปที่ Tab Dashboard -> Views -> Manage Views
2. ทำการ เลือก ปุ่ม 3 จุด แล้ว เลือก Import
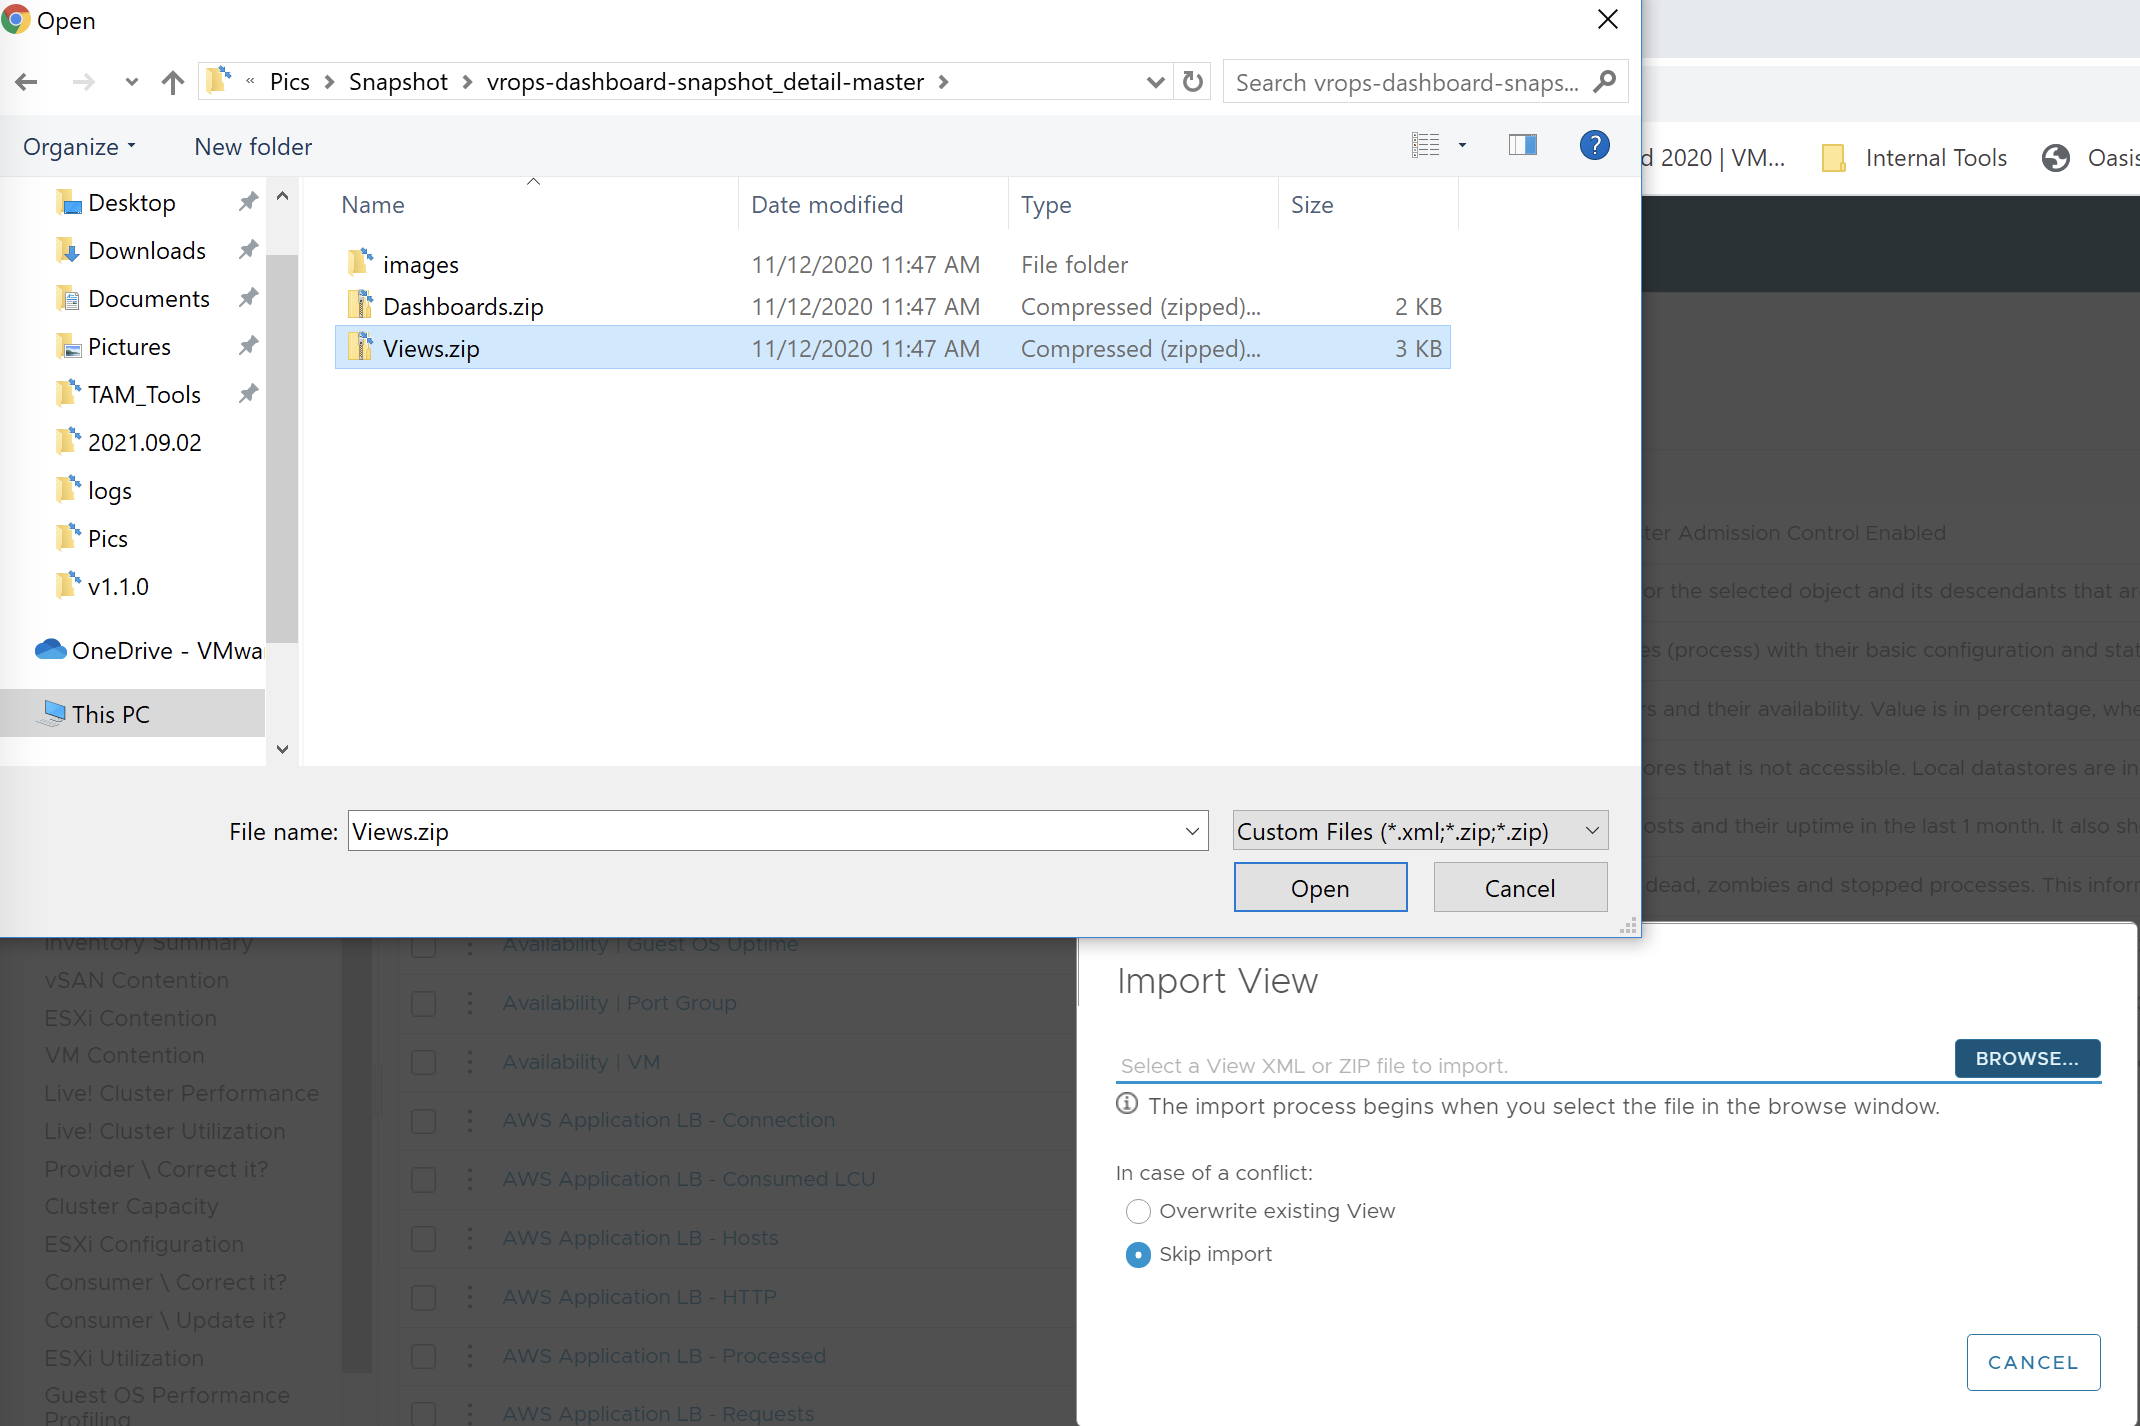
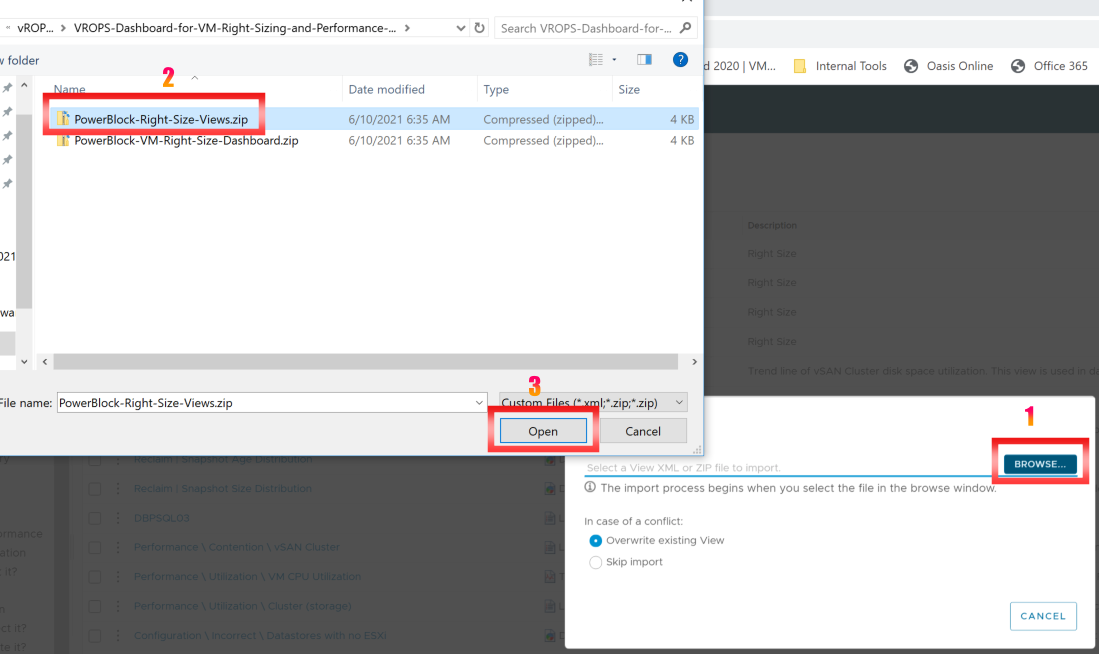
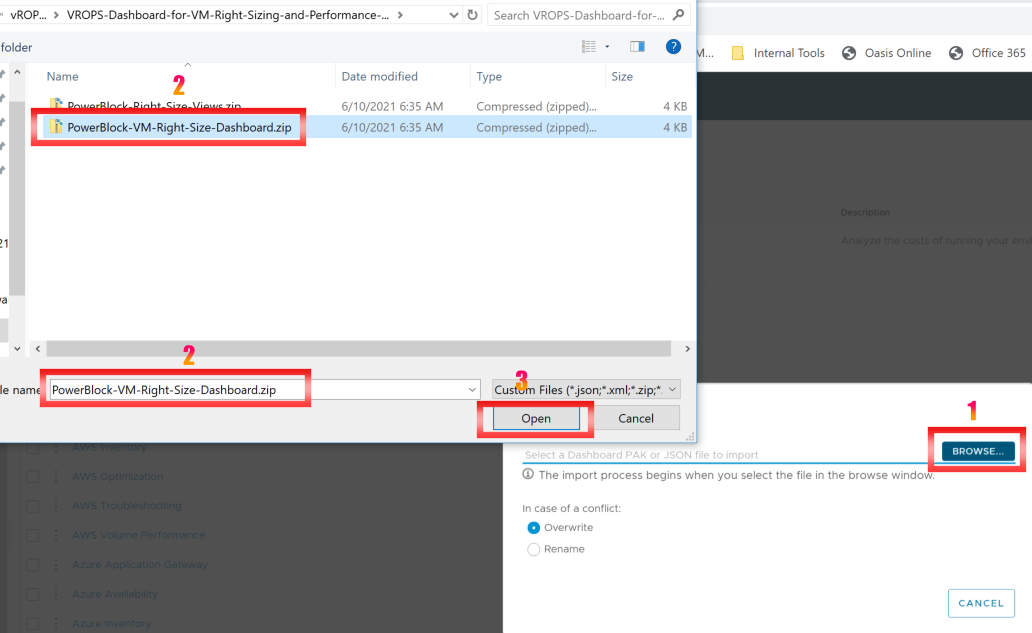
3. ทำการ Browse ไปยัง location ที่เราทำการ Download ไฟล์ Views ไว้ตอนแรกต้น แล้ว Click Open
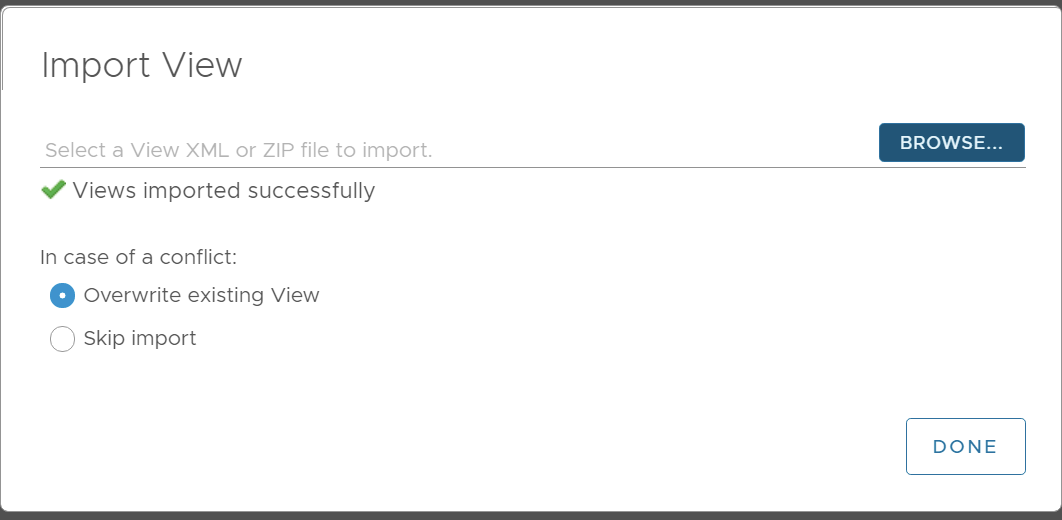
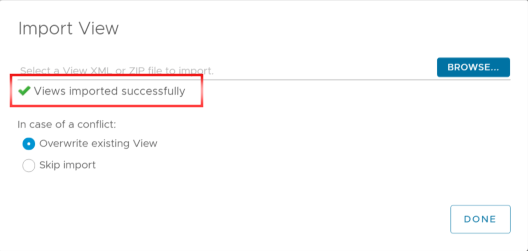
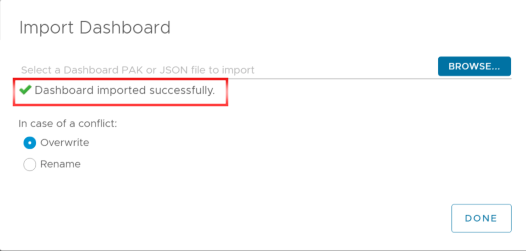
4. Views imported successfully แล้วก็ Click DONE
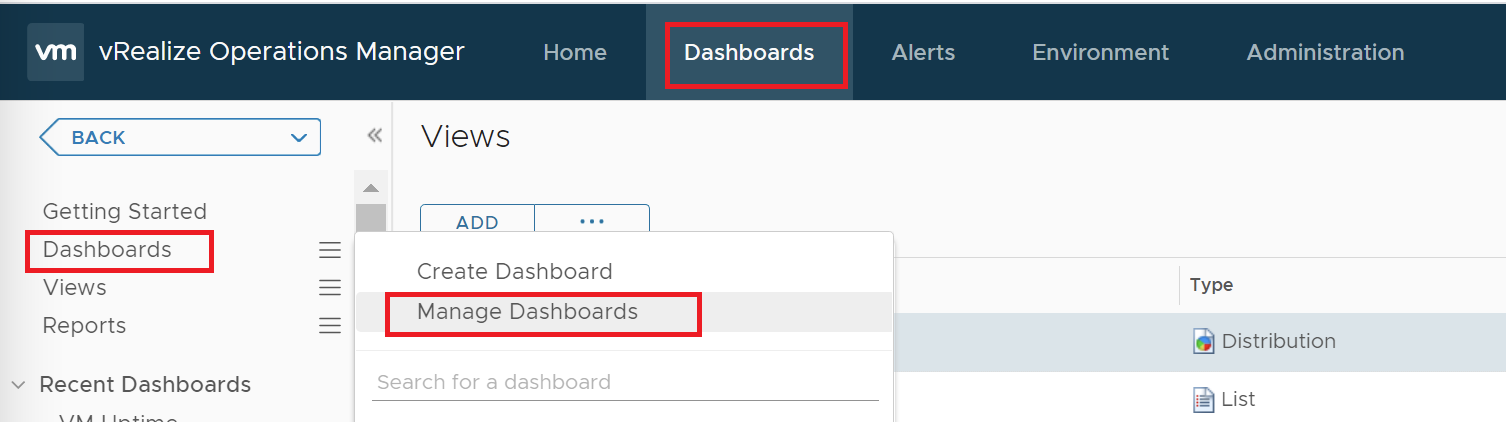
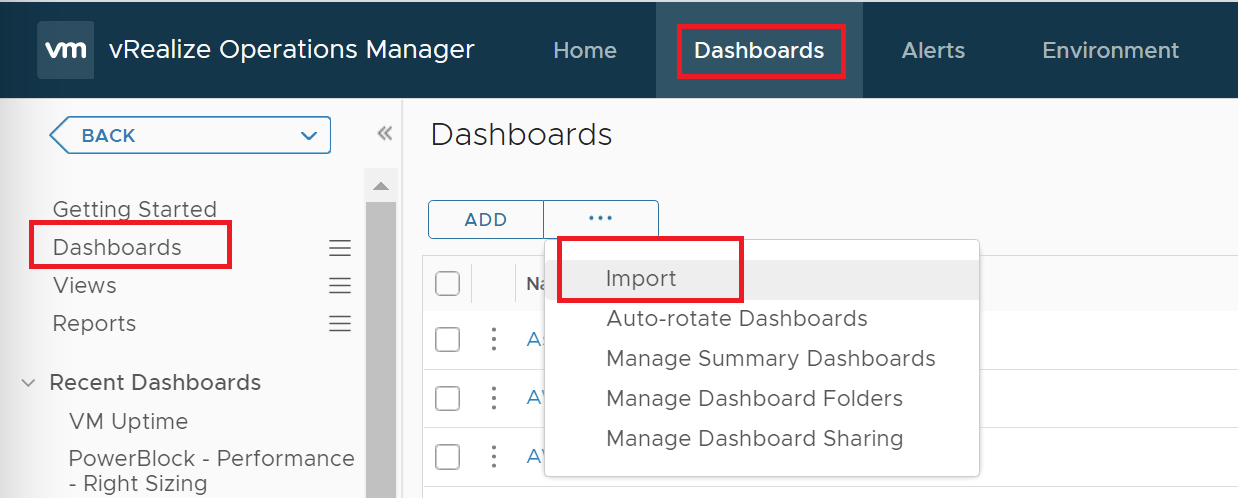
5. ไปที่ Tab Dashboard -> Dashboards -> Manage Dashboards
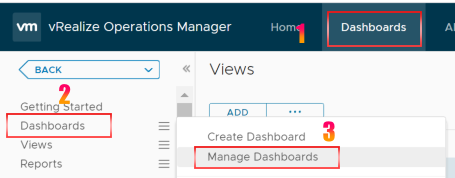
6. ทำการ เลือก ปุ่ม 3 จุด แล้ว เลือก Import
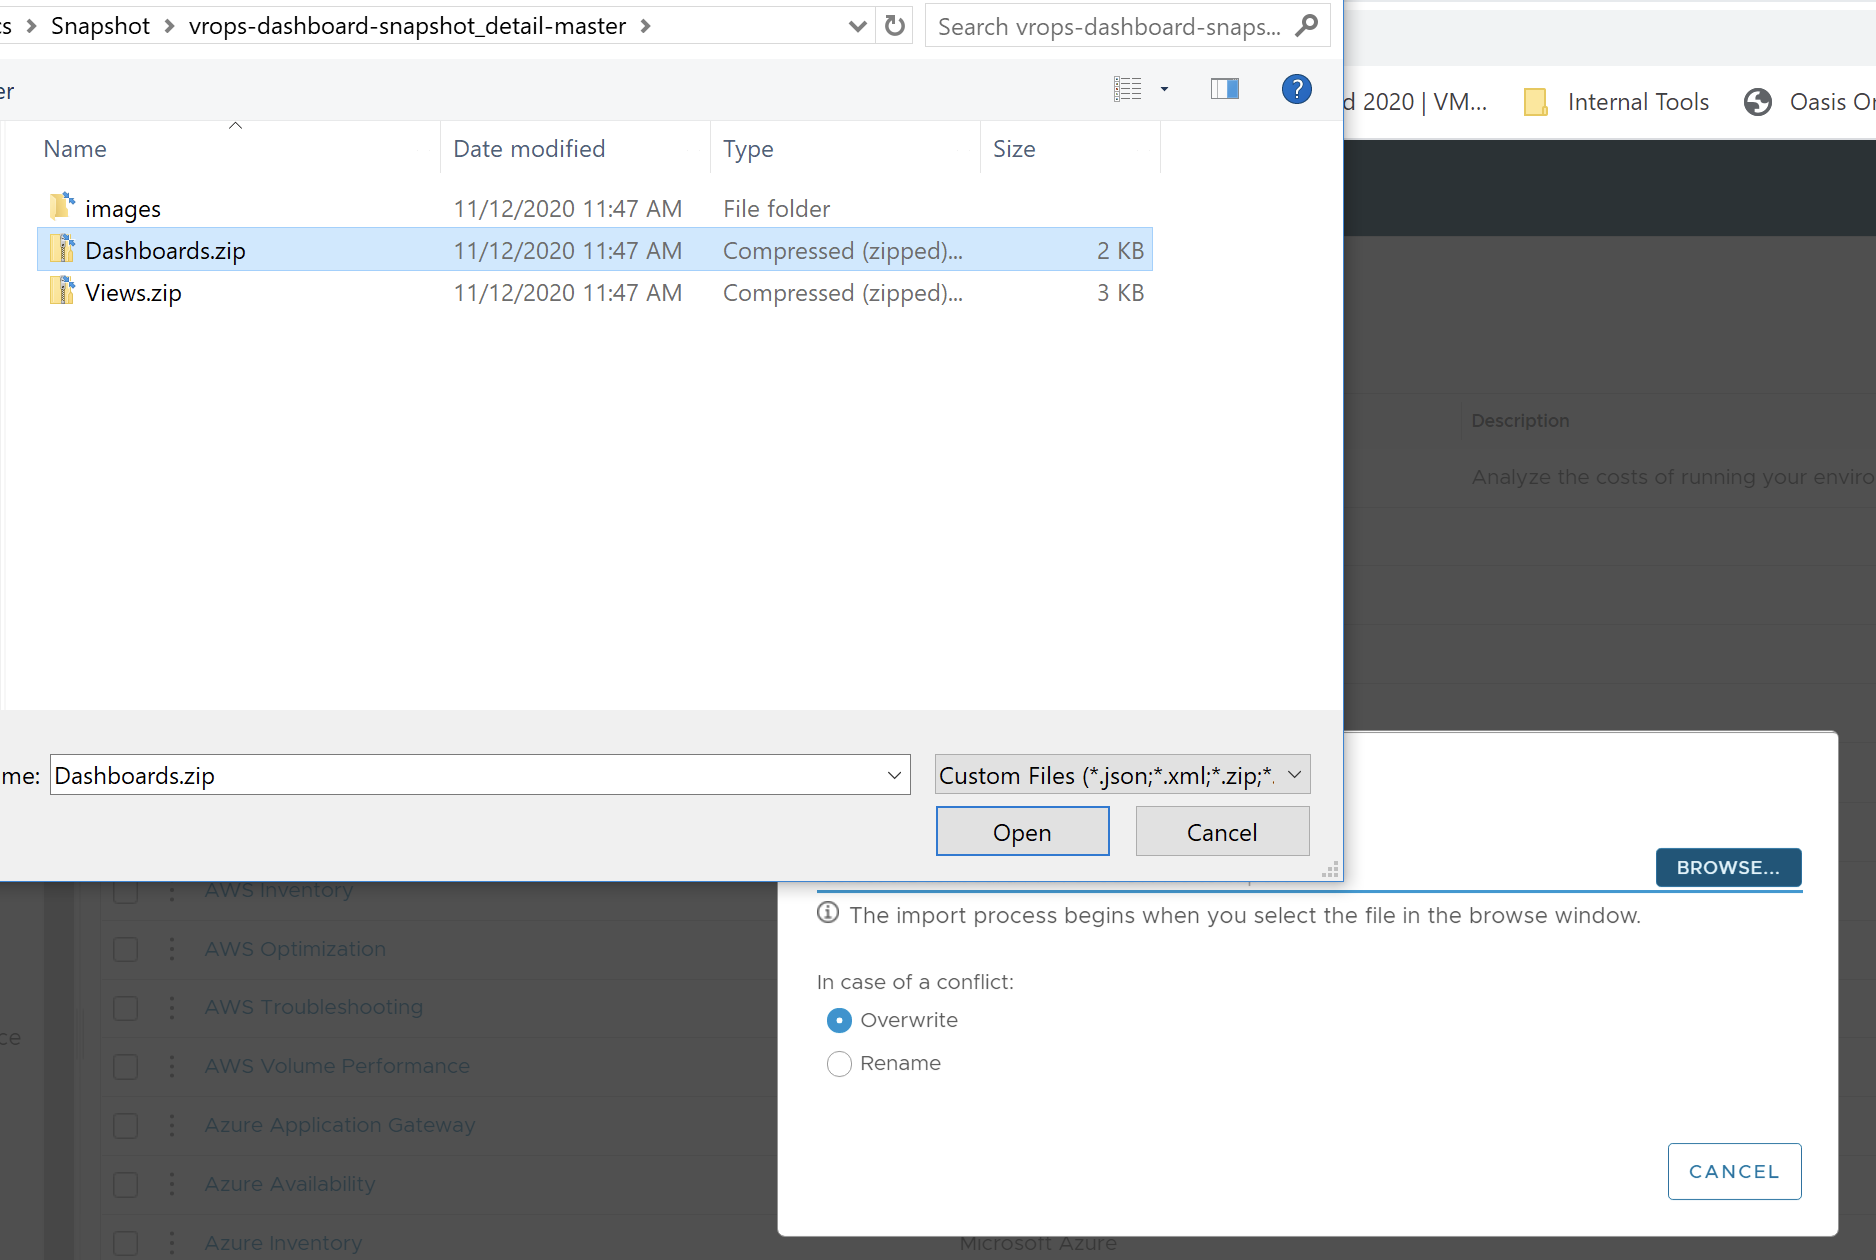
7. ทำการ Browse ไปยัง location ที่เราทำการ Download ไฟล์ Dashboardsไว้ตอนแรกต้น แล้ว Click Open
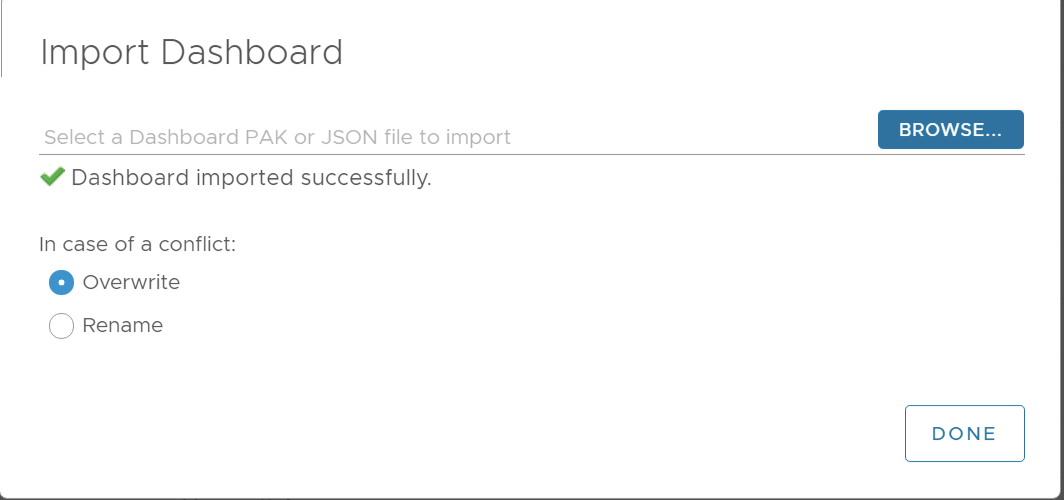
7. Dashboards imported successfully แล้วก็ Click DONE
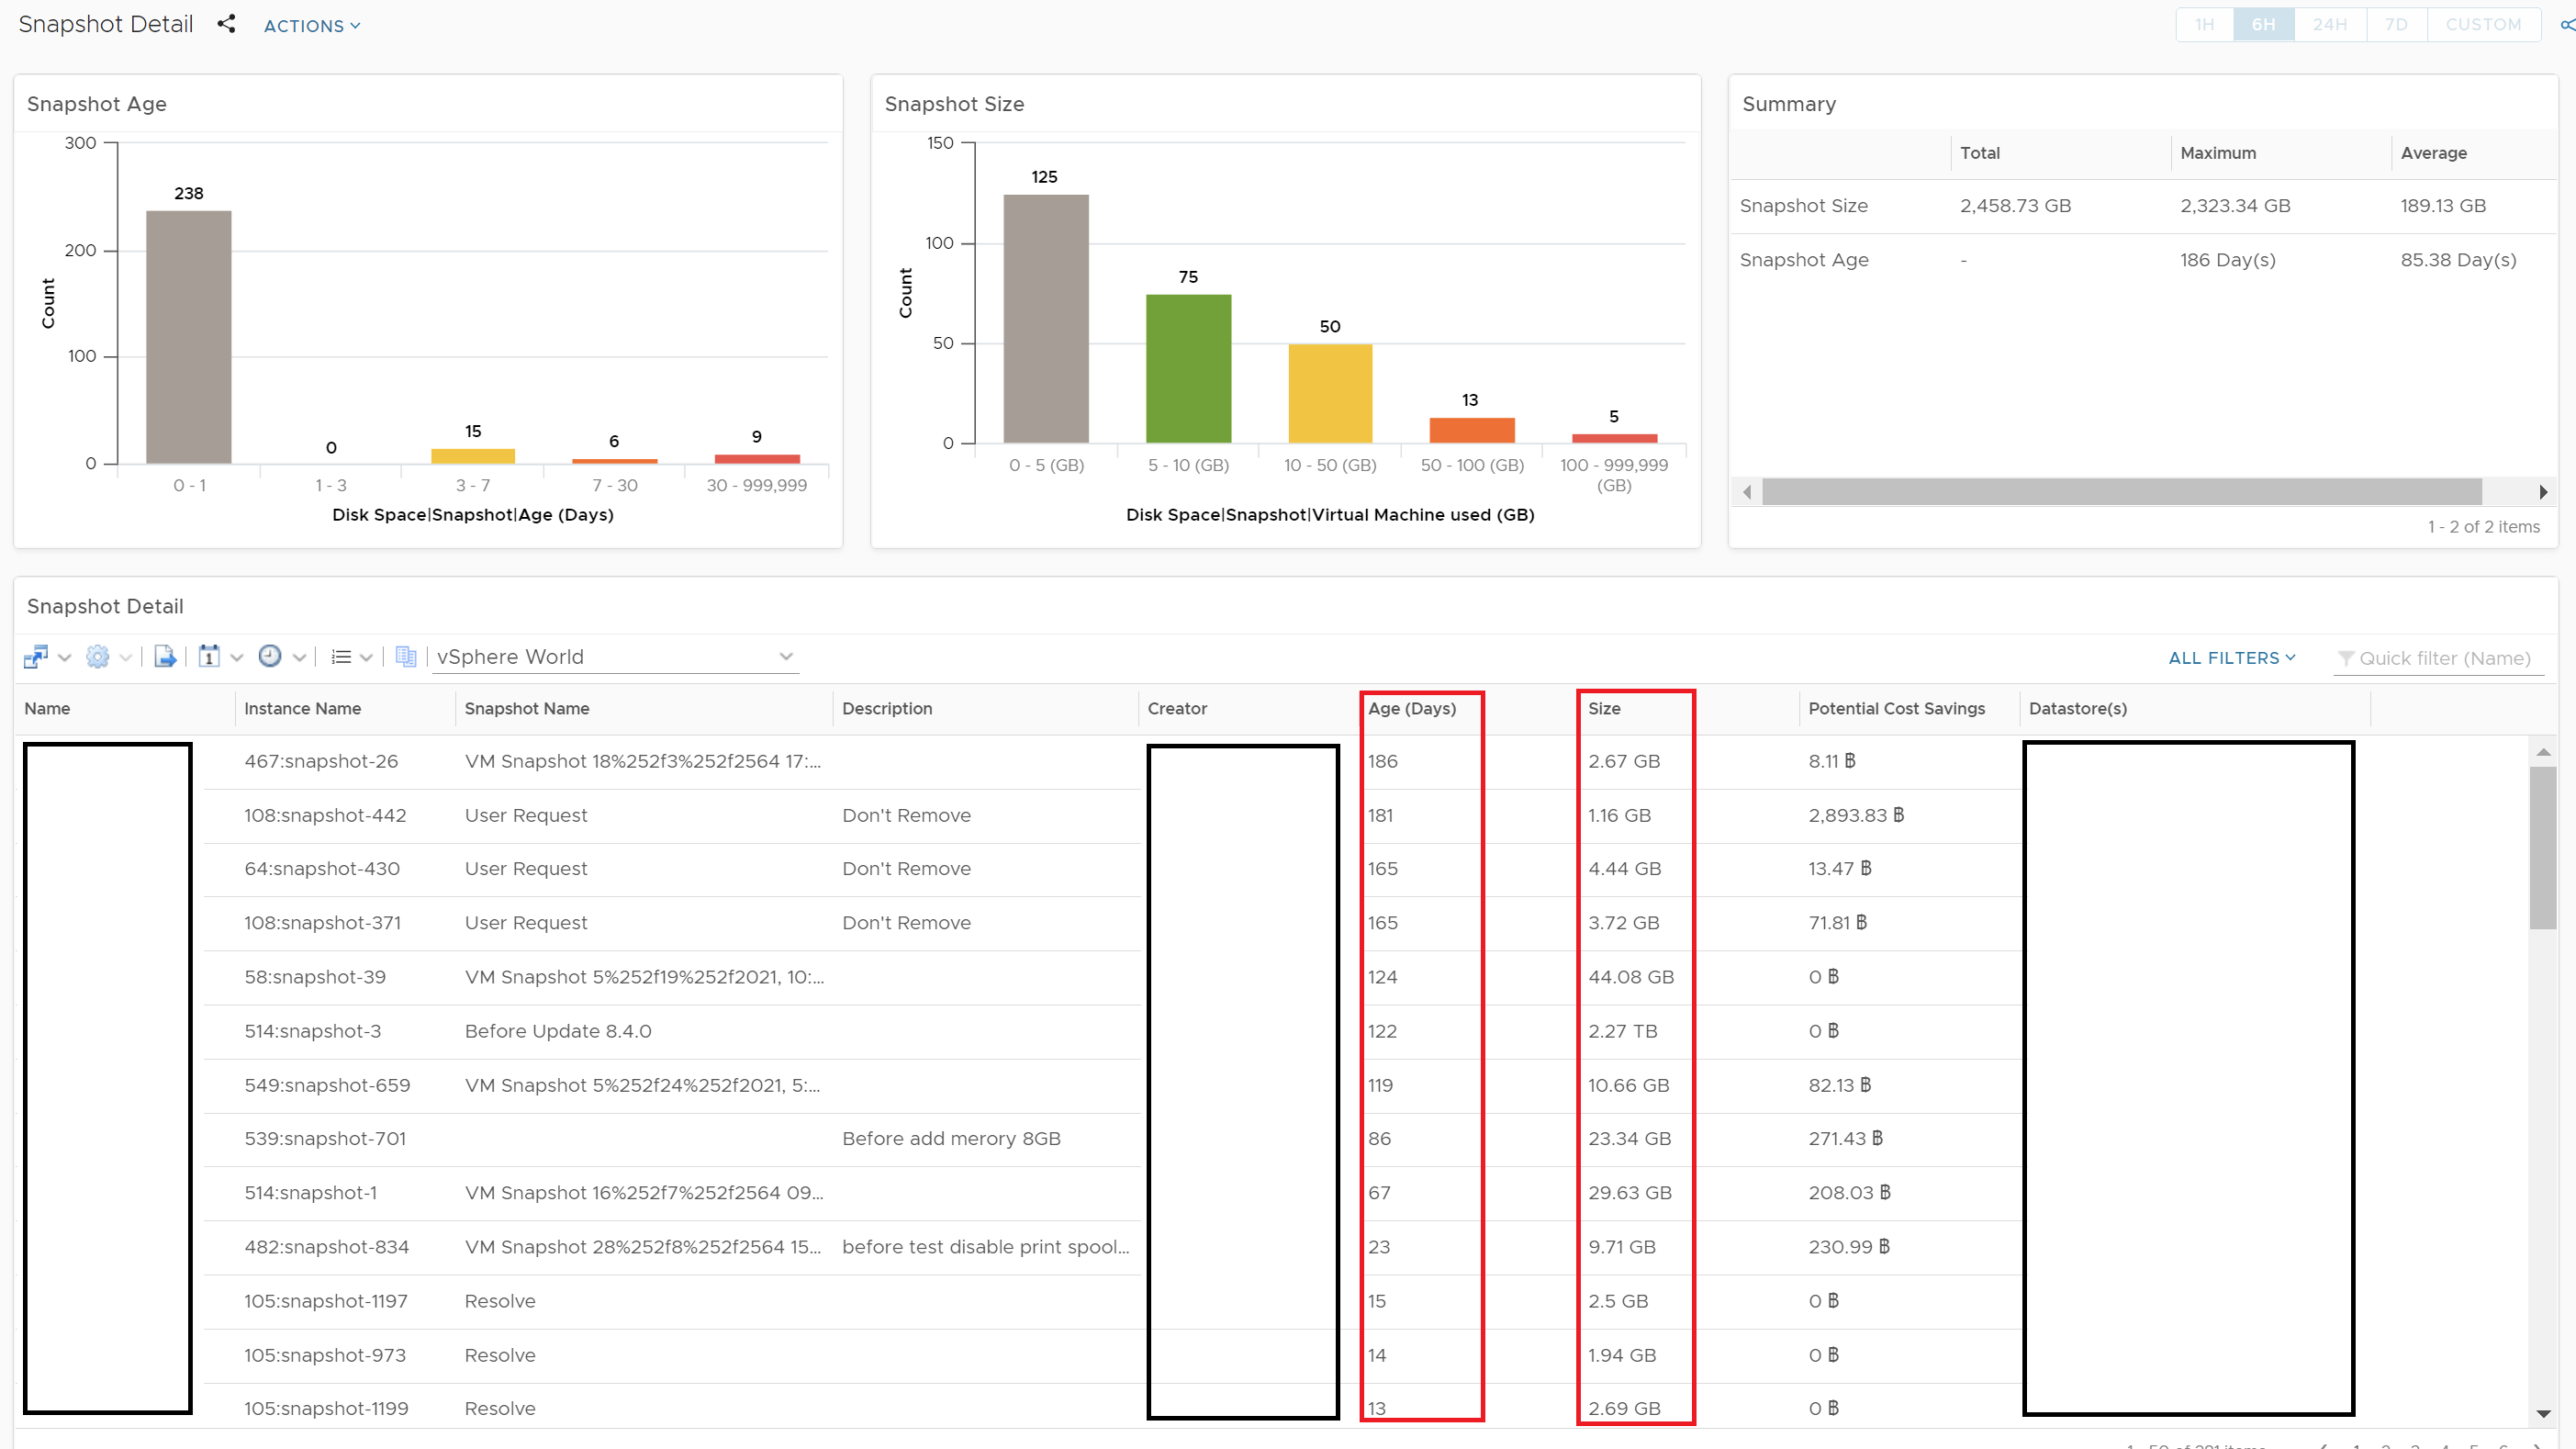
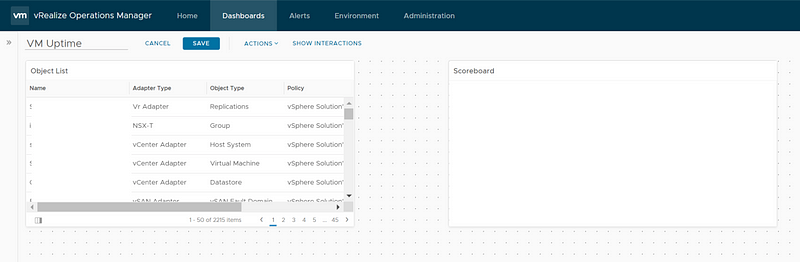
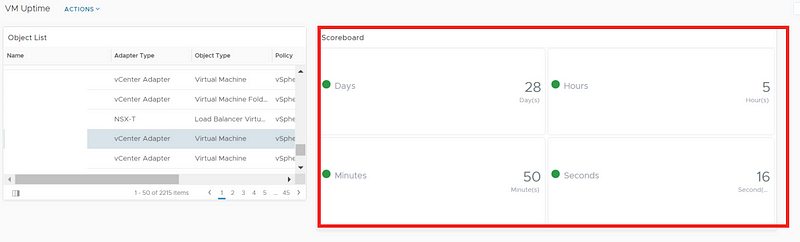
9. เราก็จะได้ หน้า Dashboards ที่แสดงค่า Performace และ Right-Sizing ของ Virtual Machine “PowerBlock – Performance – Right Sizing“
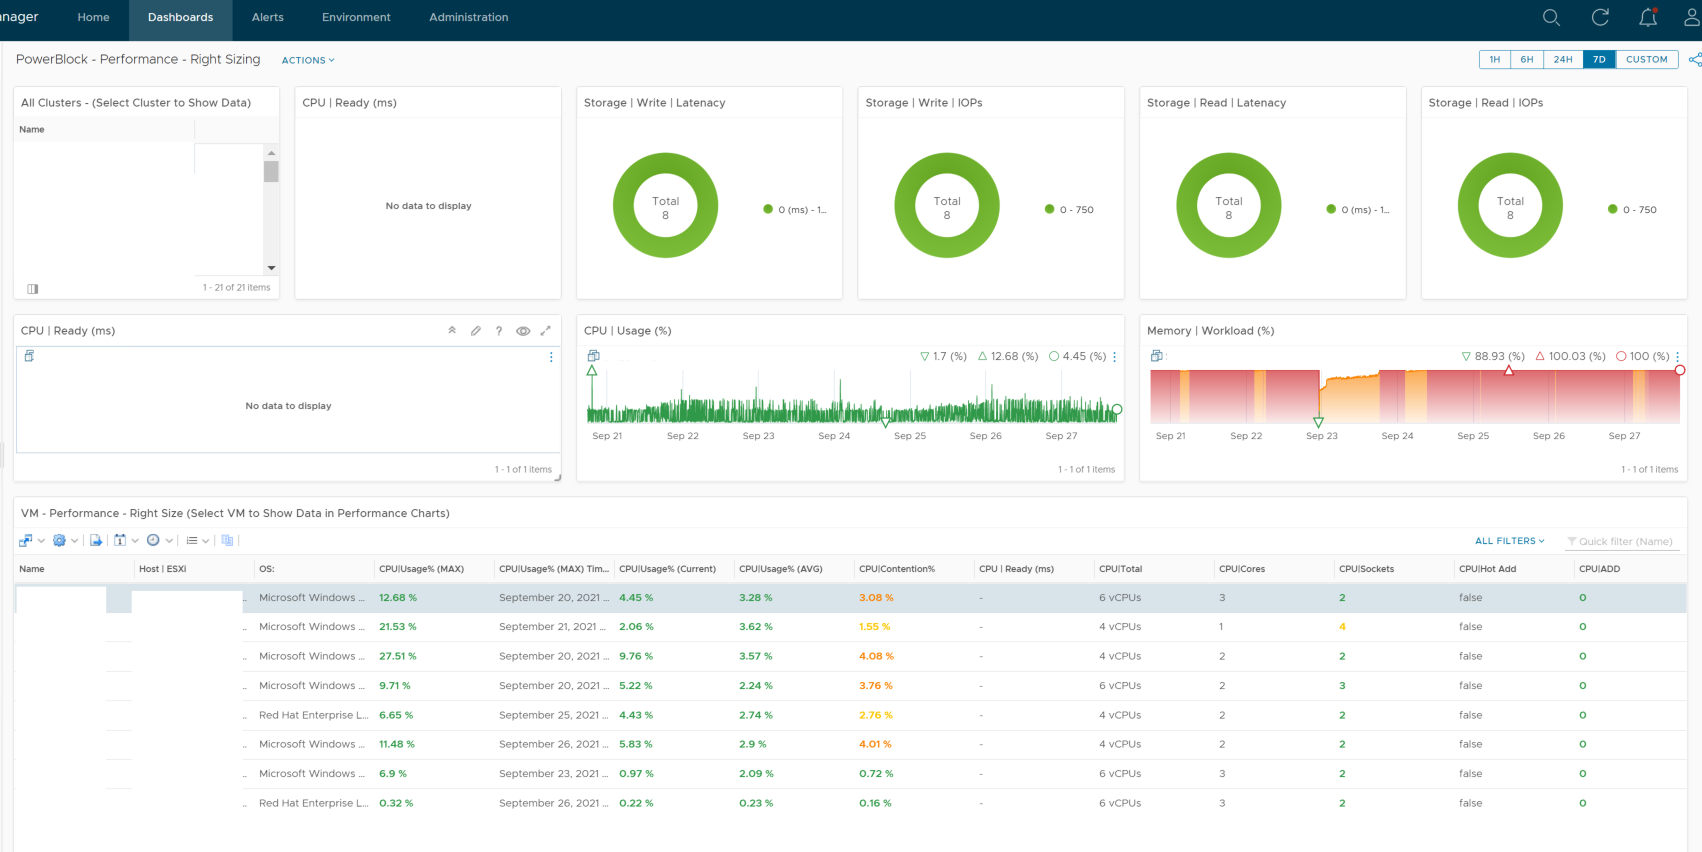
***จะสังเกตุว่าค่า Metrics ของ CPU|Ready (ms) จะไม่แสดงใน Dashboards เราจะต้องไปทำการ Enable CPU Ready (ms) metrics ขึ้นมา
Step to enable metrics CPU | Ready(ms)
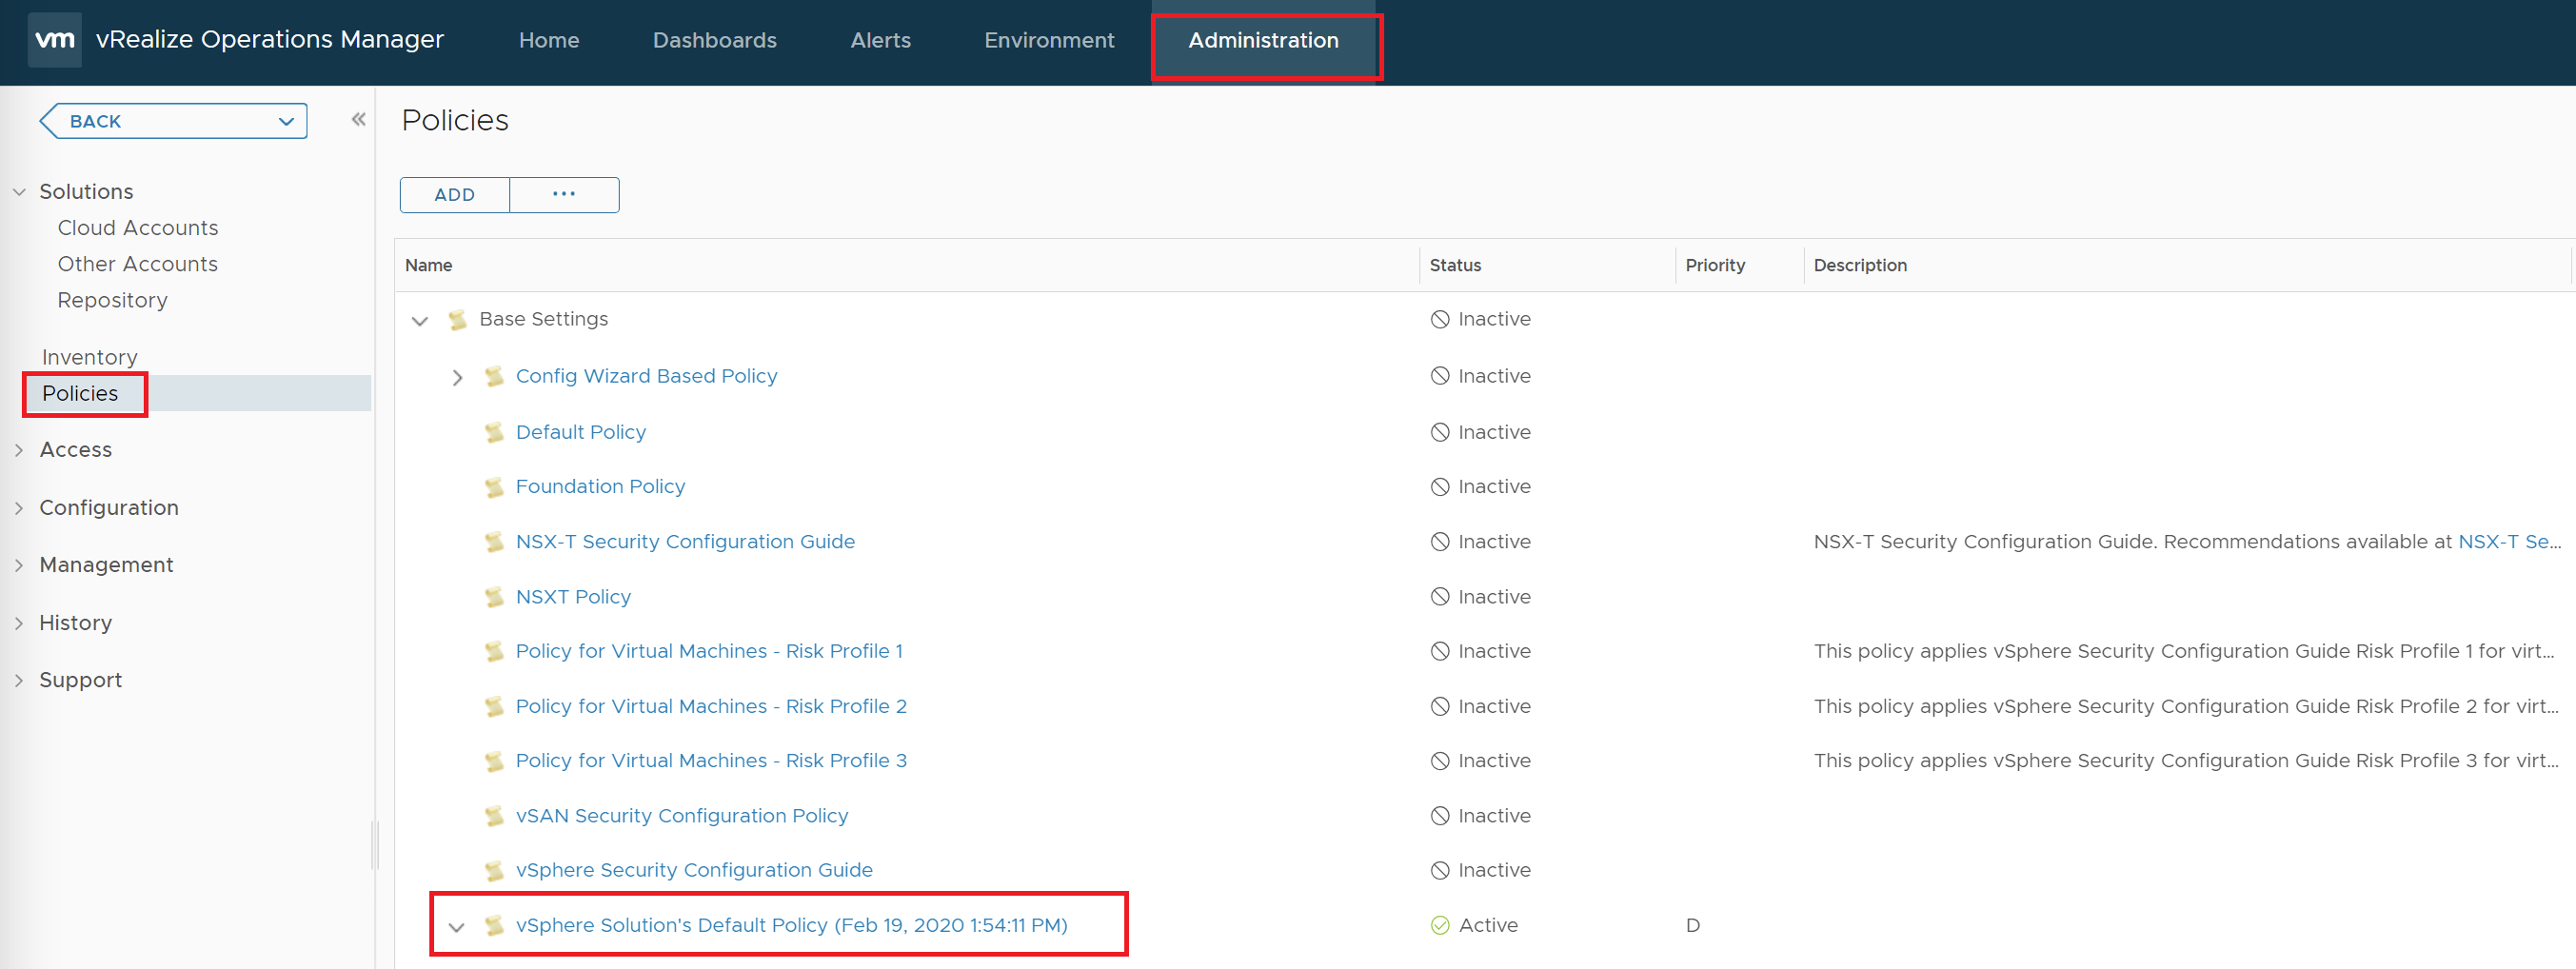
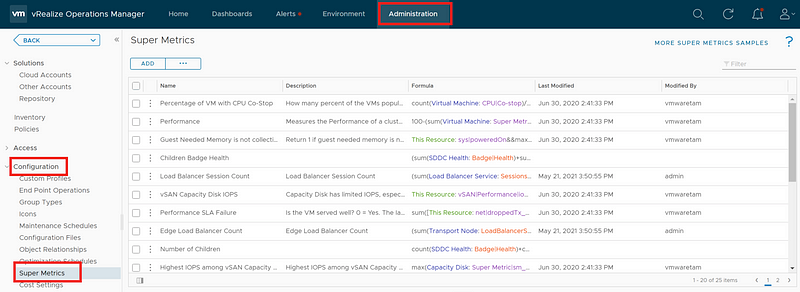
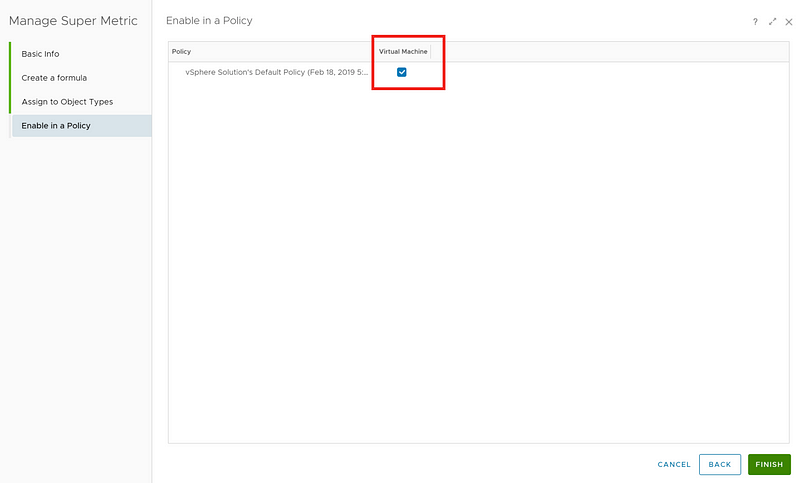
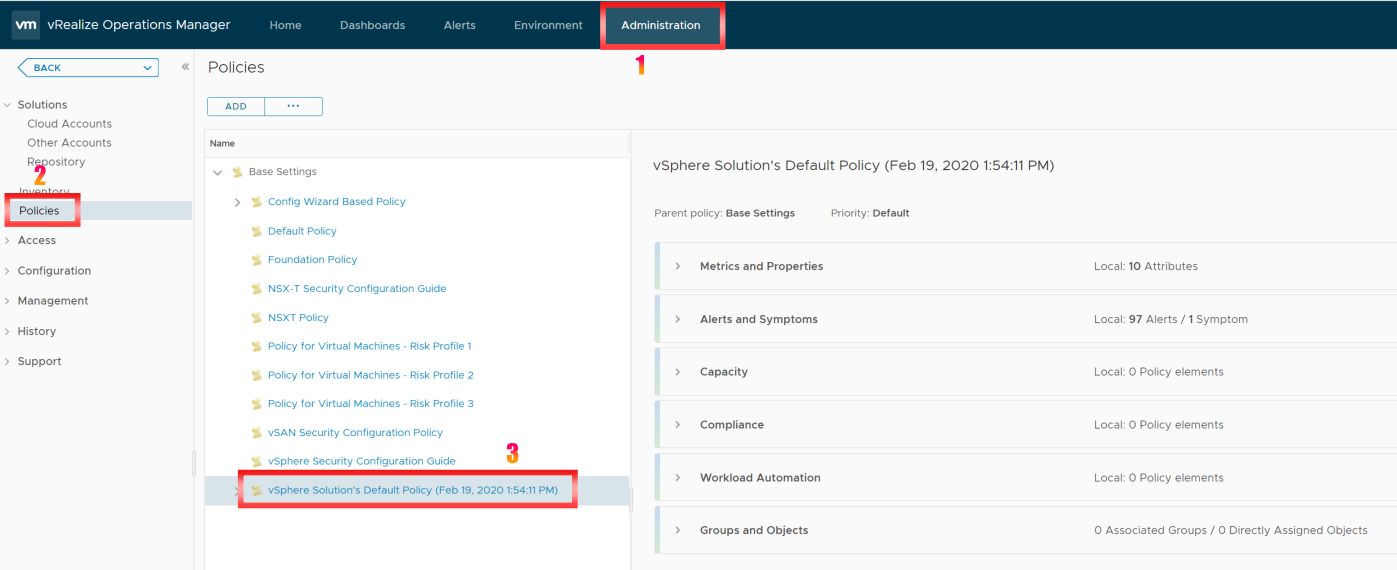
- ไปที่ Tab Administration -> Policies -> vSphere Solution’s Default Policy (Date|Time)
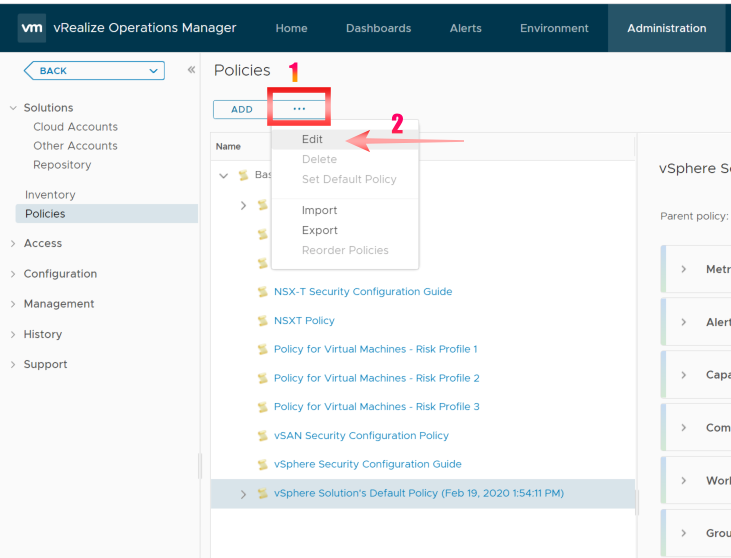
2. ทำการ เลือก ปุ่ม 3 จุด แล้ว เลือก Edit
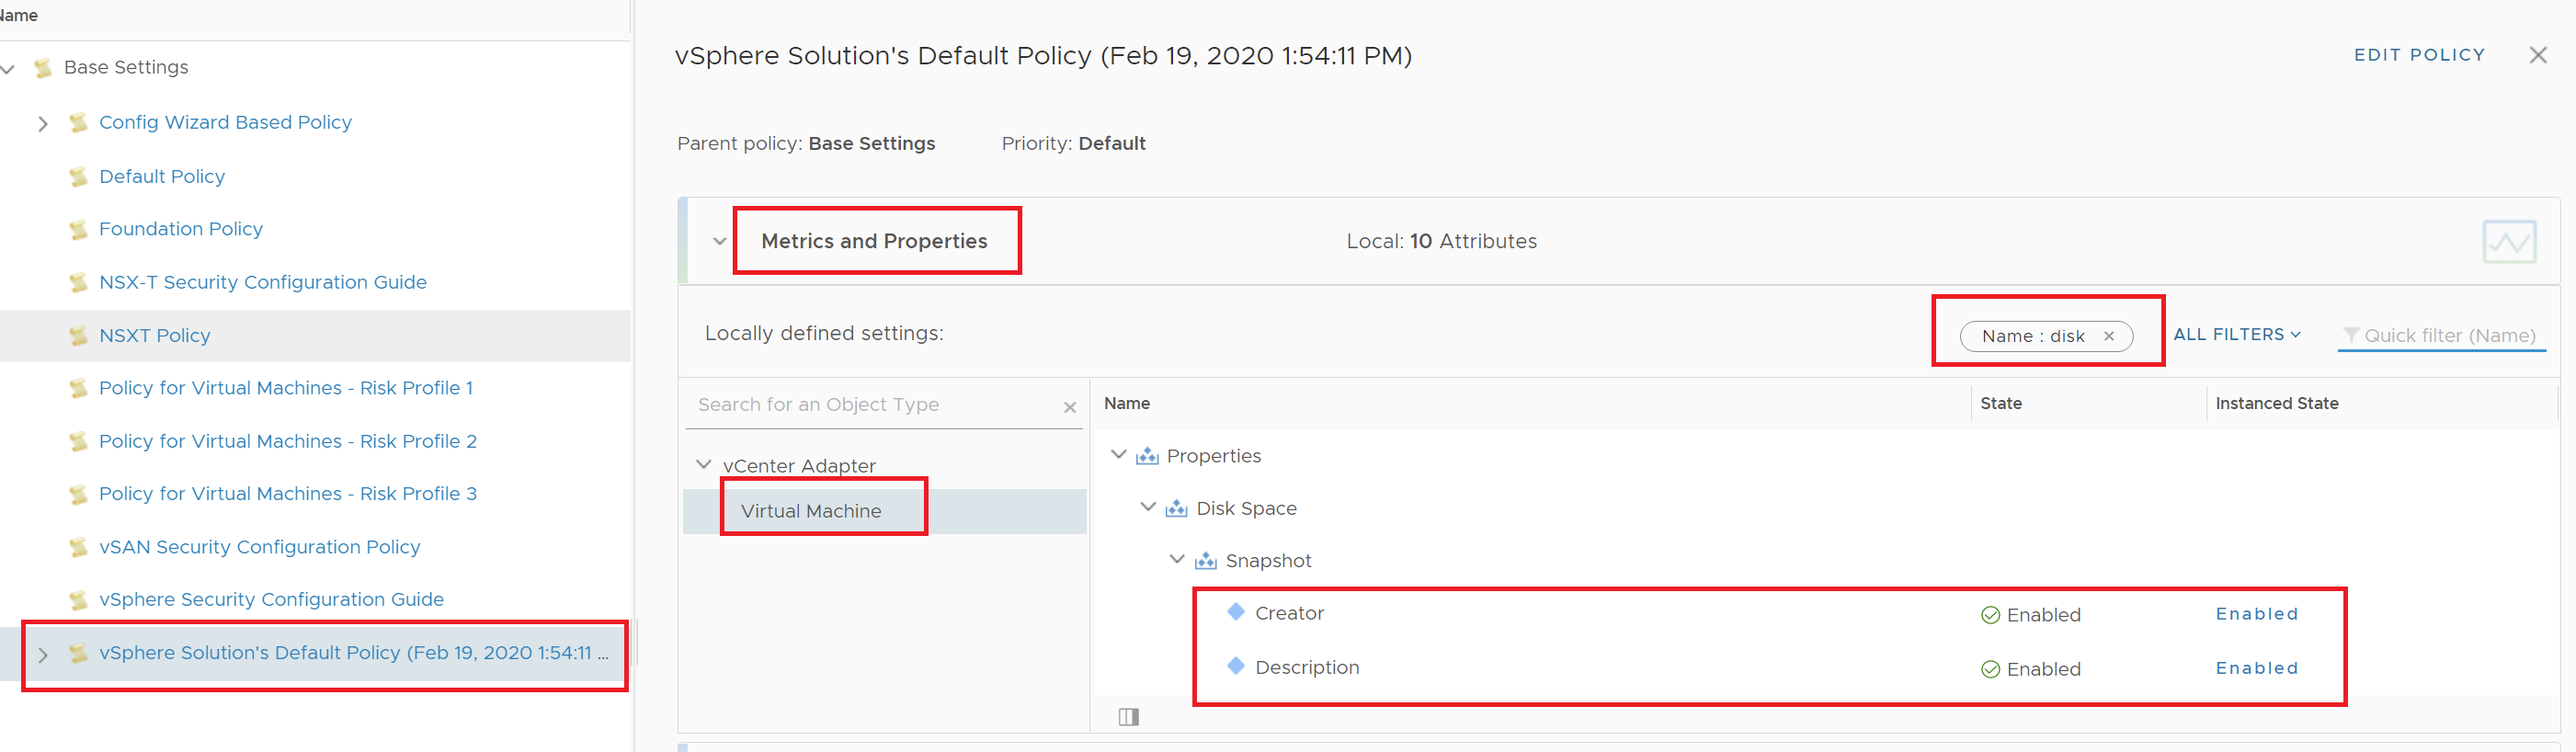
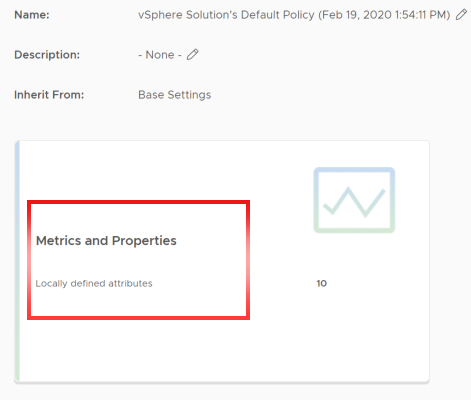
3. Click -> Metrics and Properties
4. ทำการ พิมพ์ “Virtual Machine” ในช่อง Select Object Type แล้ว Enter
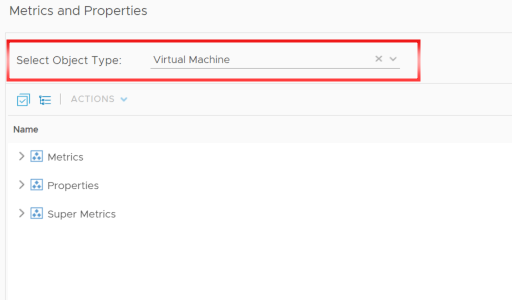
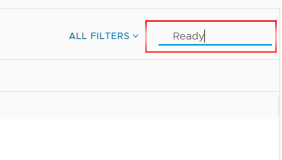
5. ในช่องด้านซ้ายมือ All FILTERS ให้พิมพ์ “Ready” แล้ว Enter
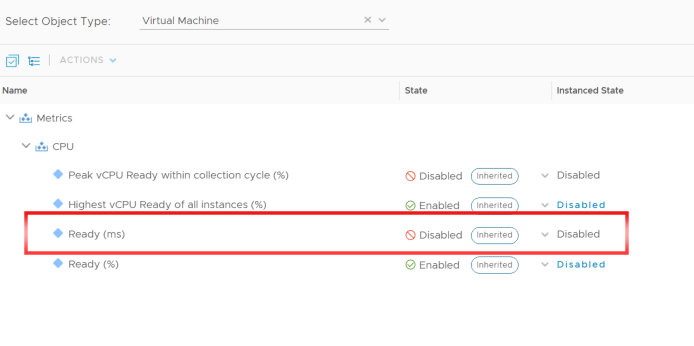
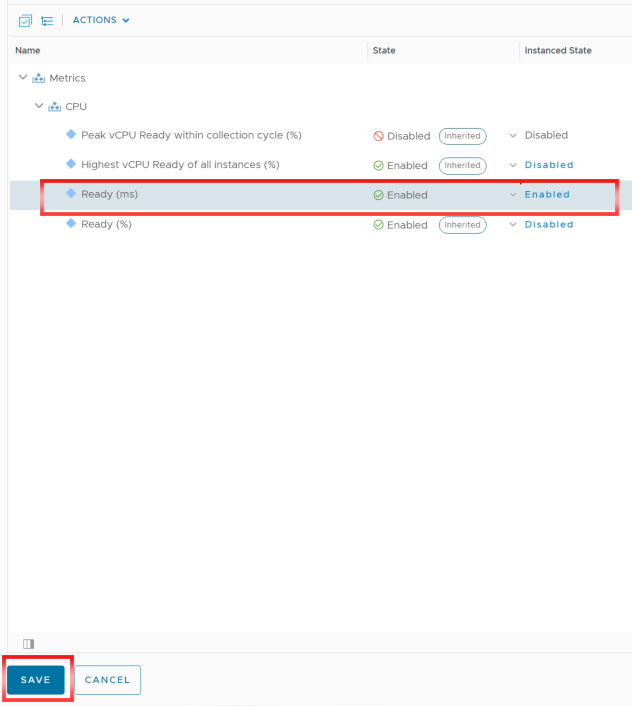
6. ทำการขยาย Metrics -> CPU แล้วจะพบคำว่า “Ready (ms)” โดย State จะเป็น Disabled
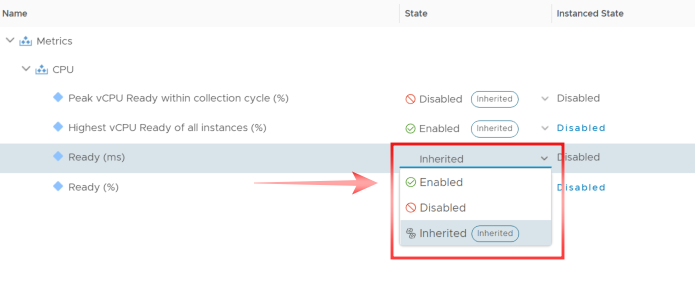
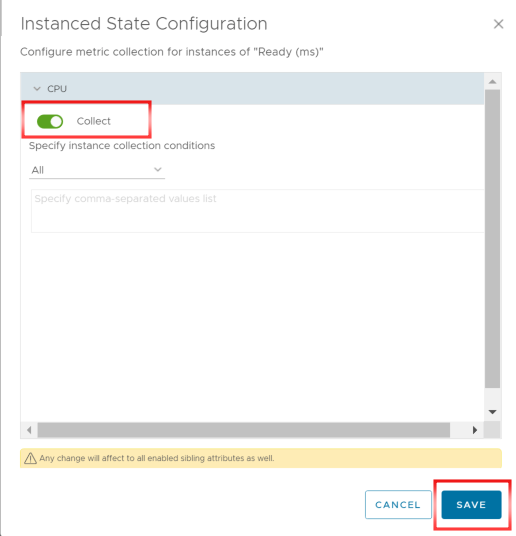
7.ทำการ “Enabled” ค่า CPU Ready (ms) ทั้งในส่วนของ State และ Instanced State ทำการ Click SAVE
8. กลับที่หน้า Dashboards -> PowerBlock – Performance – Right Sizing ก็จะแสดงค่า CPU | Ready(ms)
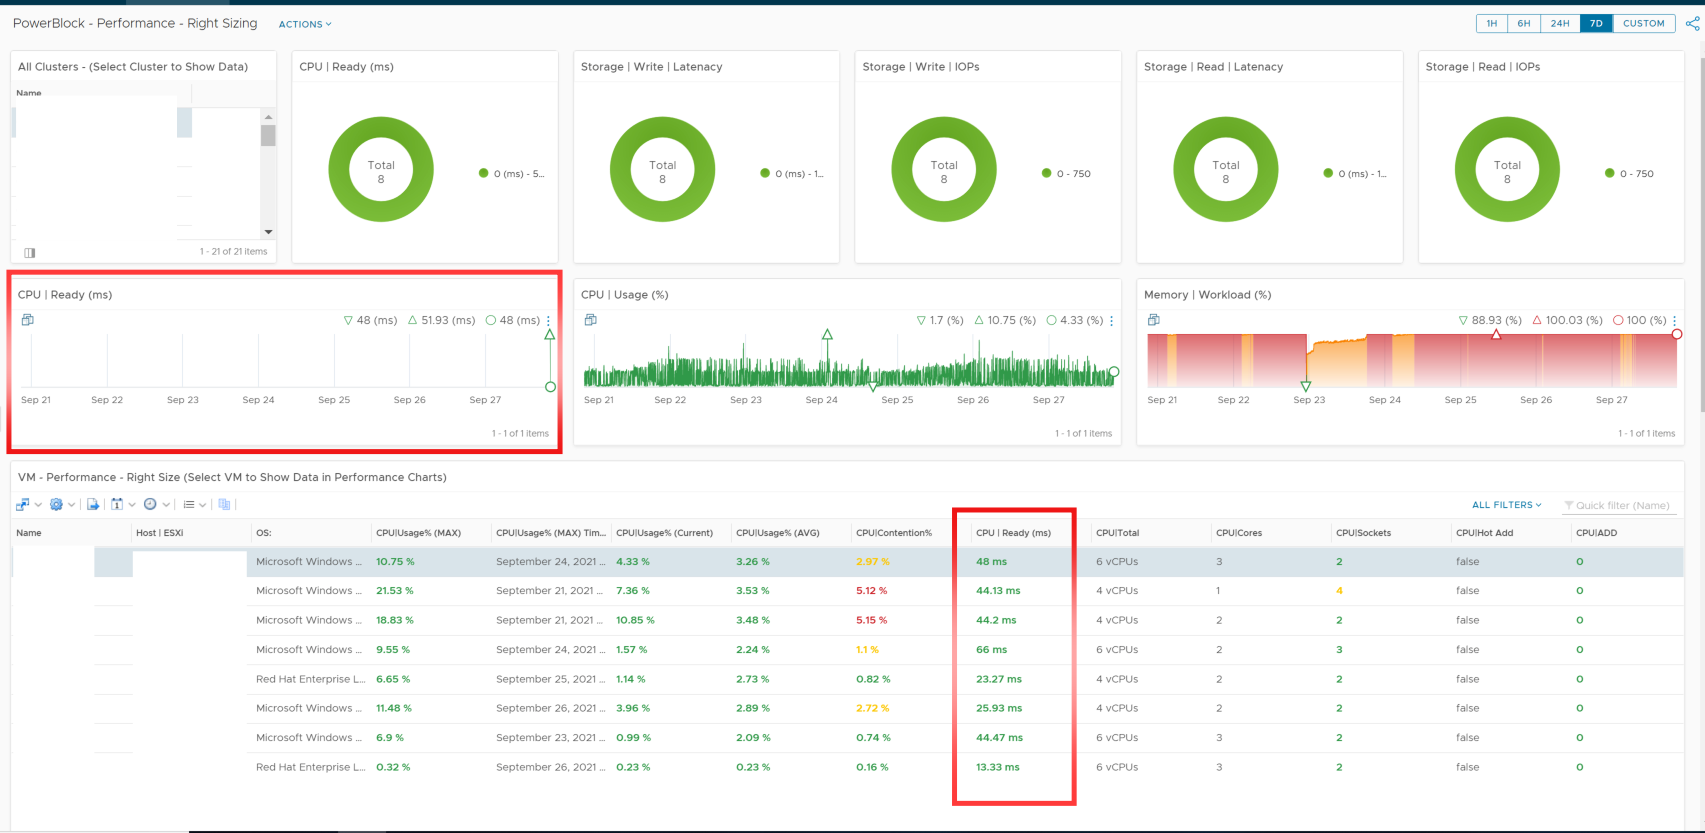
โดยค่า CPU | Ready (ms) จะบอก อะไรกับเราได้บ้าง และมีประโยชน์ อย่างไร
Performance Values:
- CPU|Ready (ms) should be 1000 or less for best performance.
- CPU|Remove – I like to keep this at 2 or less. For some applications this can be trial and error.
- CPU|Add – I like to keep this at 0. Make sure the VM is sized with enough resources. Don’t under size VMs. This will keep the APP Owners Happy!
Part 2 – Report
-ใน Part 2 เราจะมาทำการสร้าง Report จาก Dashboard ที่เราสร้างขึ้นมา
https://ilerpong.com/vrops-dashboard-for-vm-right-sizing-and-performance-part-2/